Census 2022 maps based on police district data

In August of this year Stats SA released data from Census 2022 at the level of police districts (precincts). With 1,167 police districts this is considerably more granular than the municipal-level data that was previously available. That being said, it is nothing like the ward-level data that was previously promised or the small area data available from Census 2011.

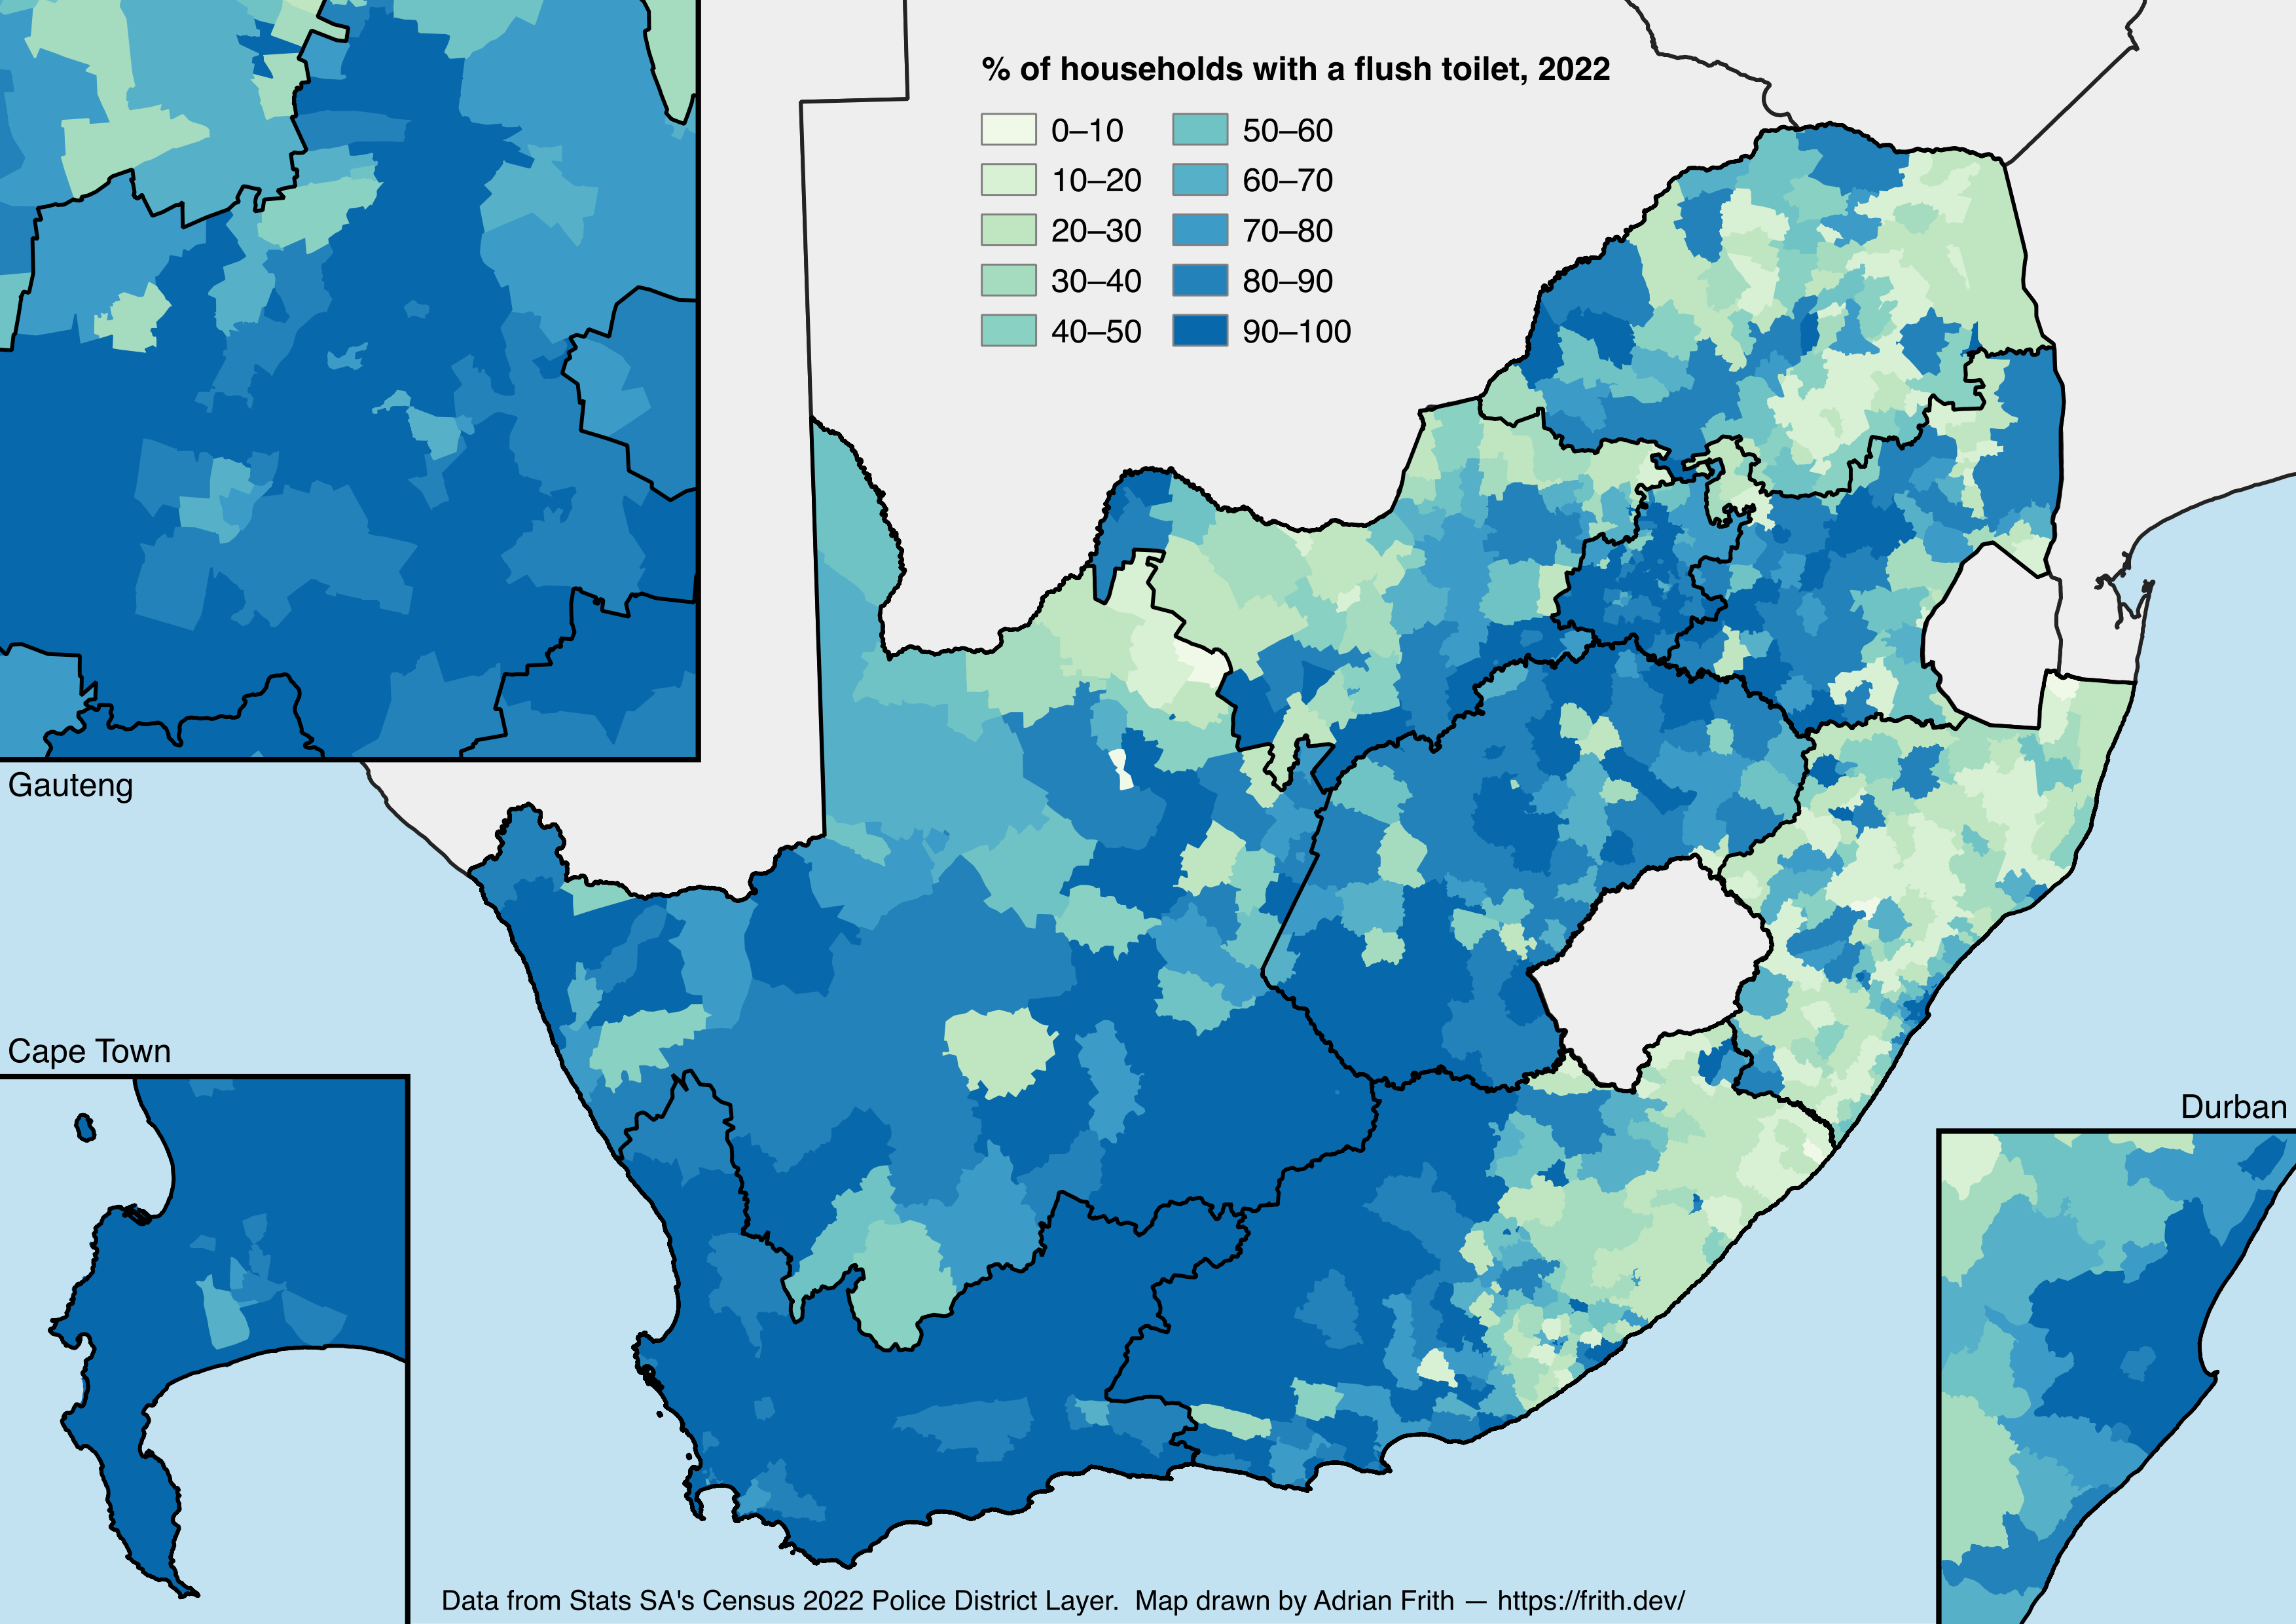
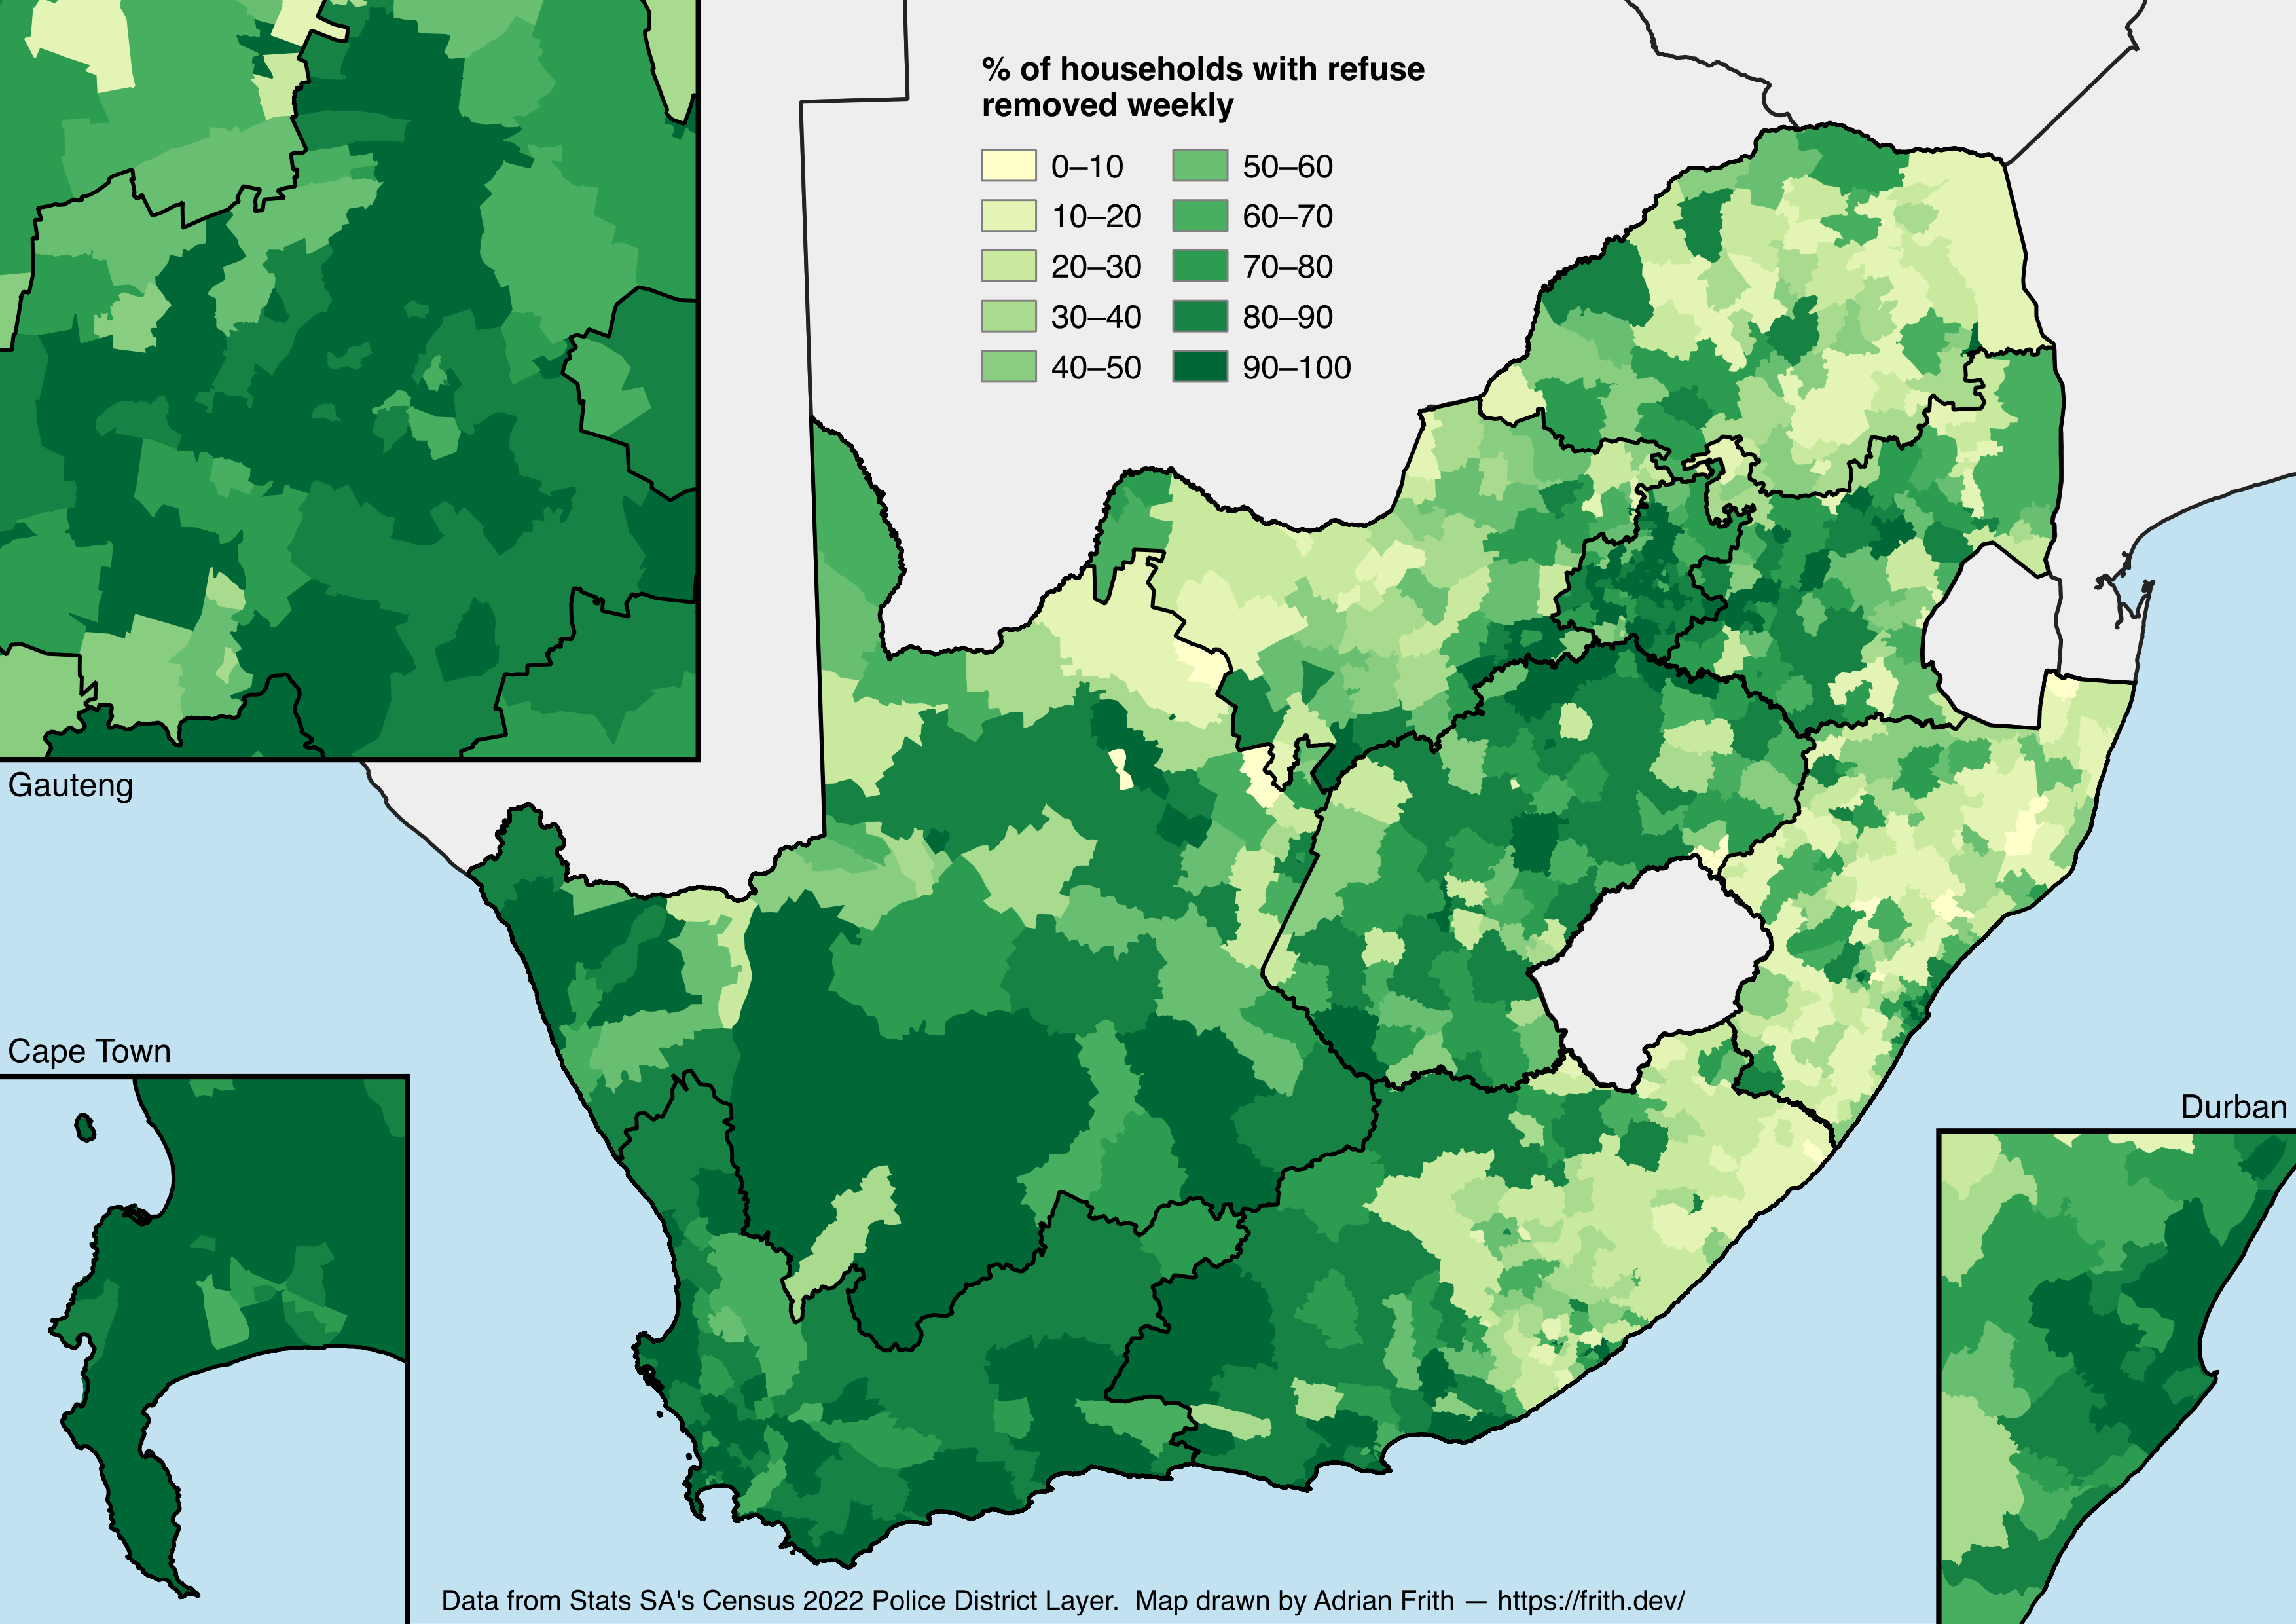
I’ve produced a collection of maps visualising some of the metrics from this police-district data layer, which you can see below. Click each one for the full-size image.

A map depicting population density in South Africa according to the 2022 Census.
Population density
A map depicting the majority home languages in South Africa according to the 2022 Census.
Majority home language
Percentage identifying with each of the four main “population groups”
A map depicting the percentage of households in South Africa using electricity for lighting according to the 2022 Census.
Percentage of households using electricity for lighting
A map depicting the percentage of households in South Africa with piped water according to the 2022 Census.
Percentage of households with piped water in the dwelling or yard
A map depicting the percentage of households in South Africa with a flush toilet according to the 2022 Census.
Percentage of households with a flushing toilet
A map depicting the percentage of households in South Africa with refuse removed weekly according to the 2022 Census.
Percentage of households with refuse removed weekly

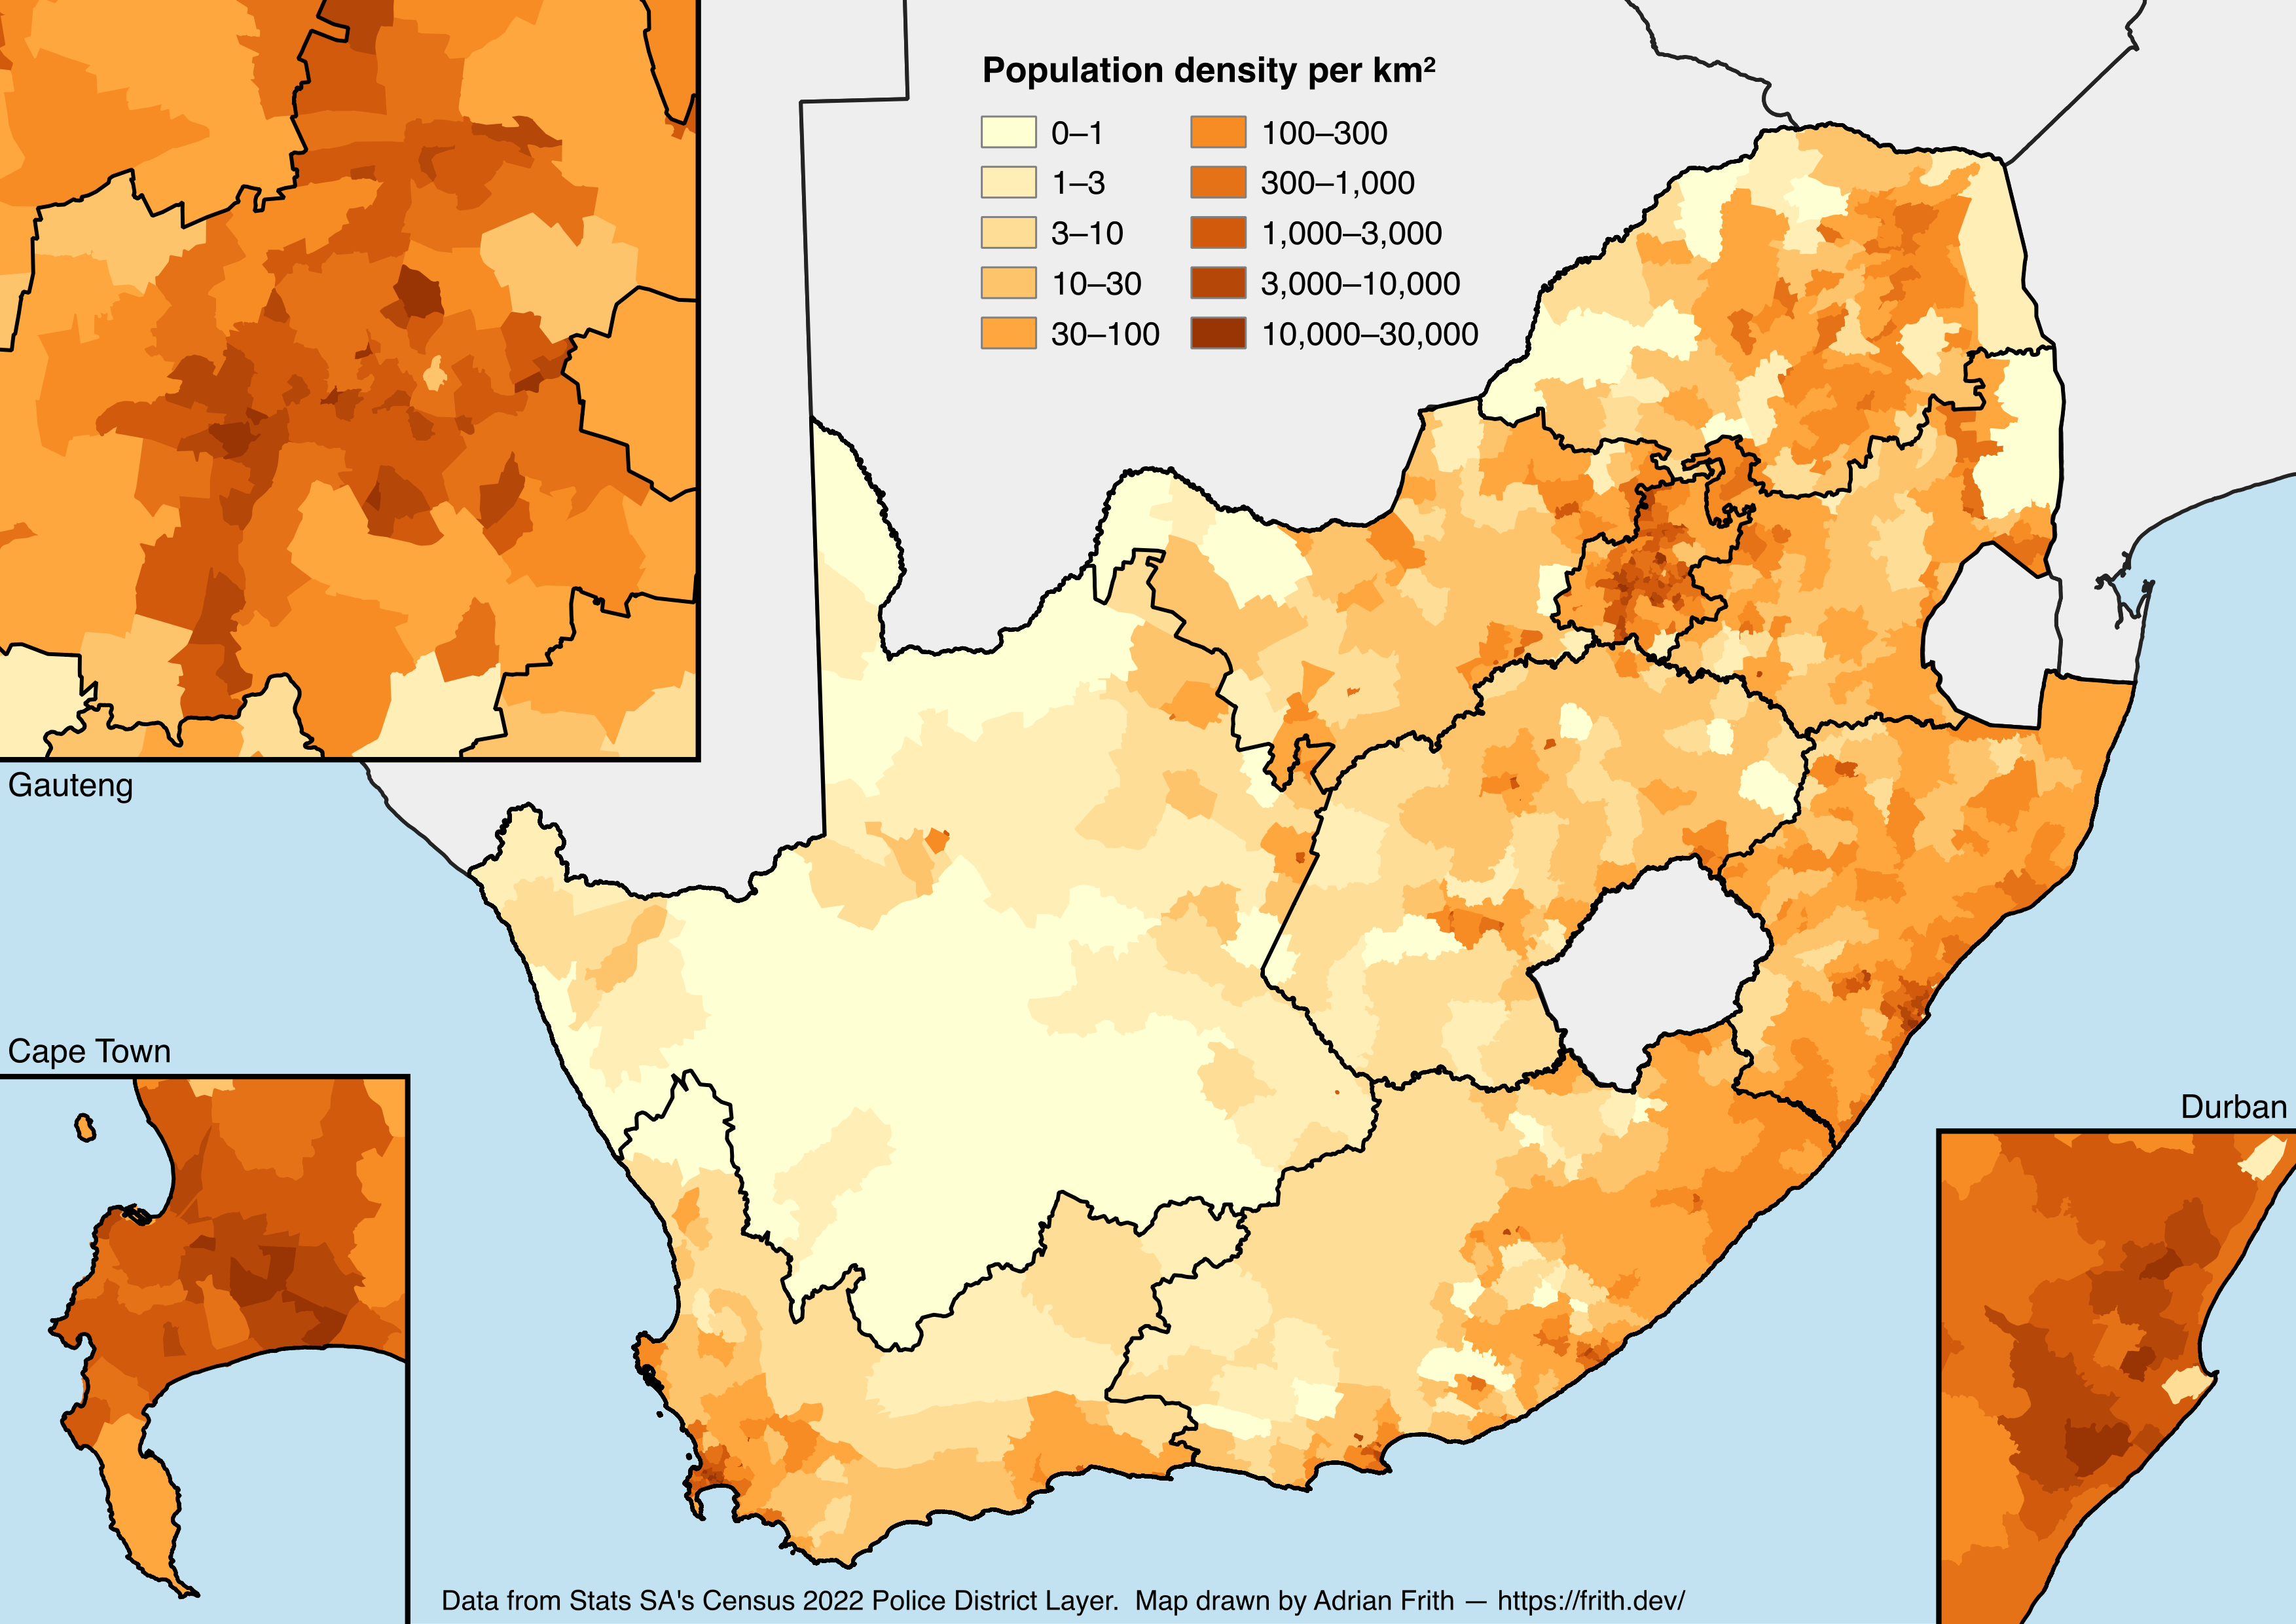
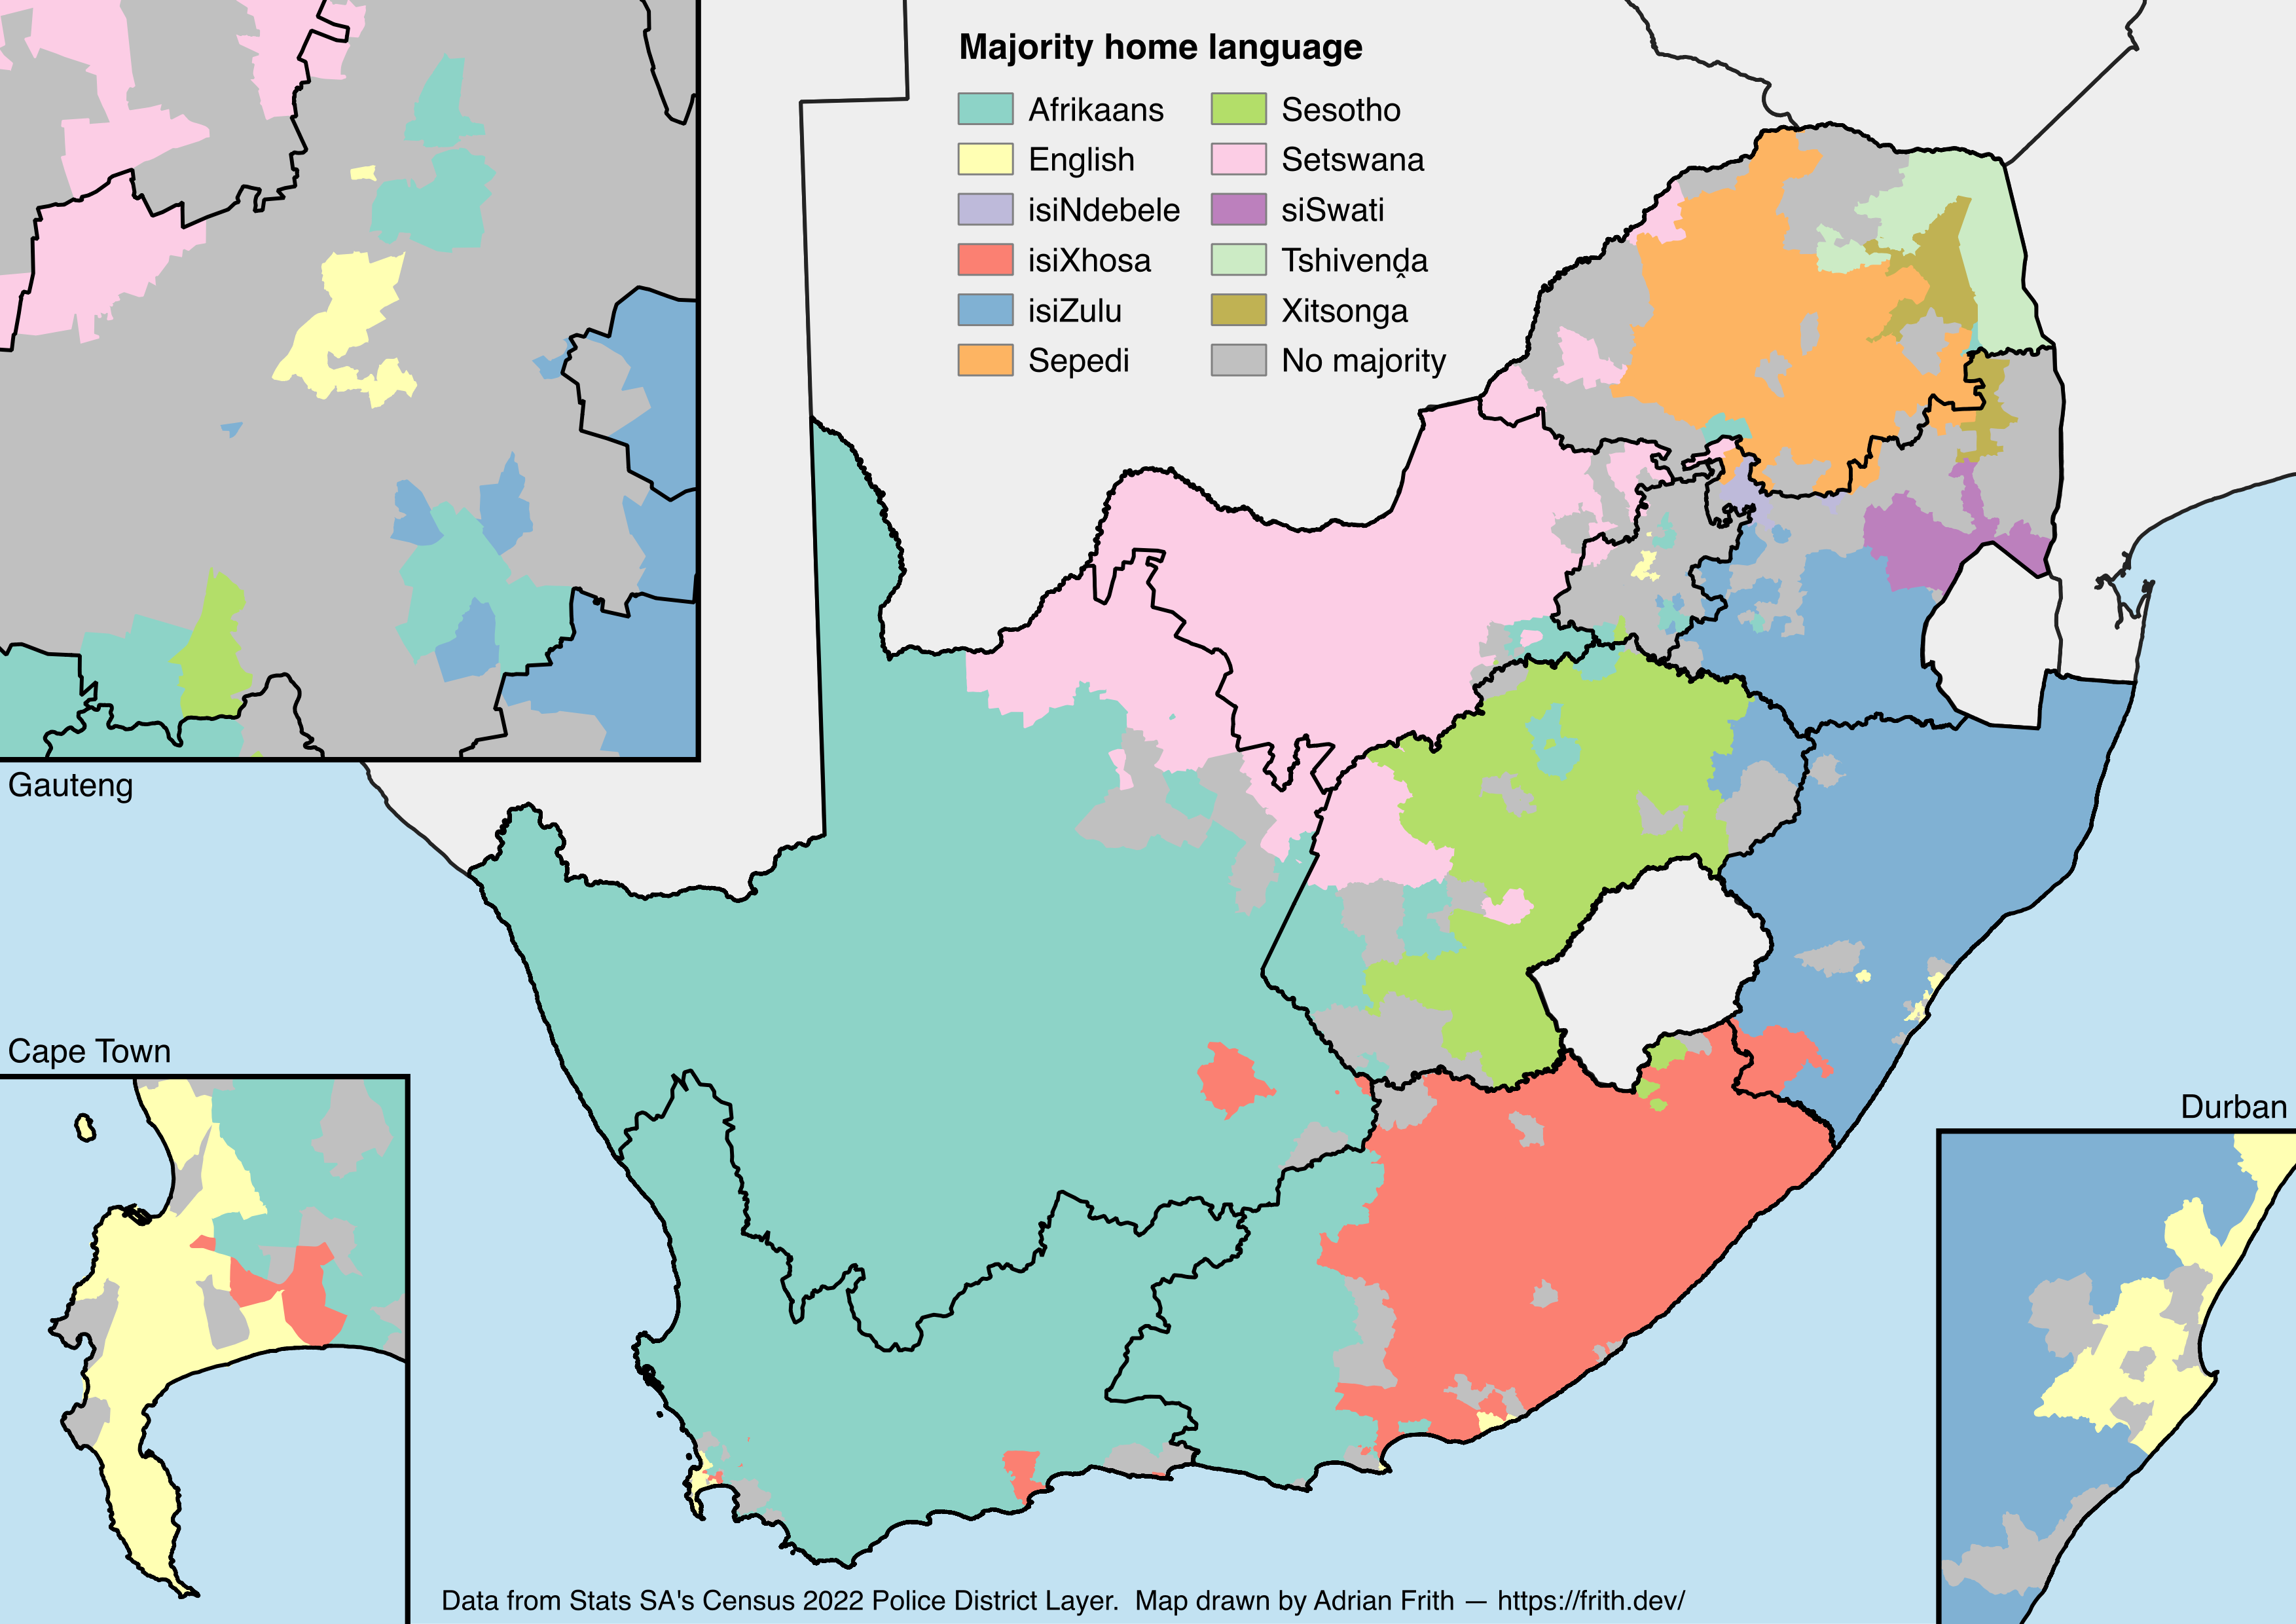
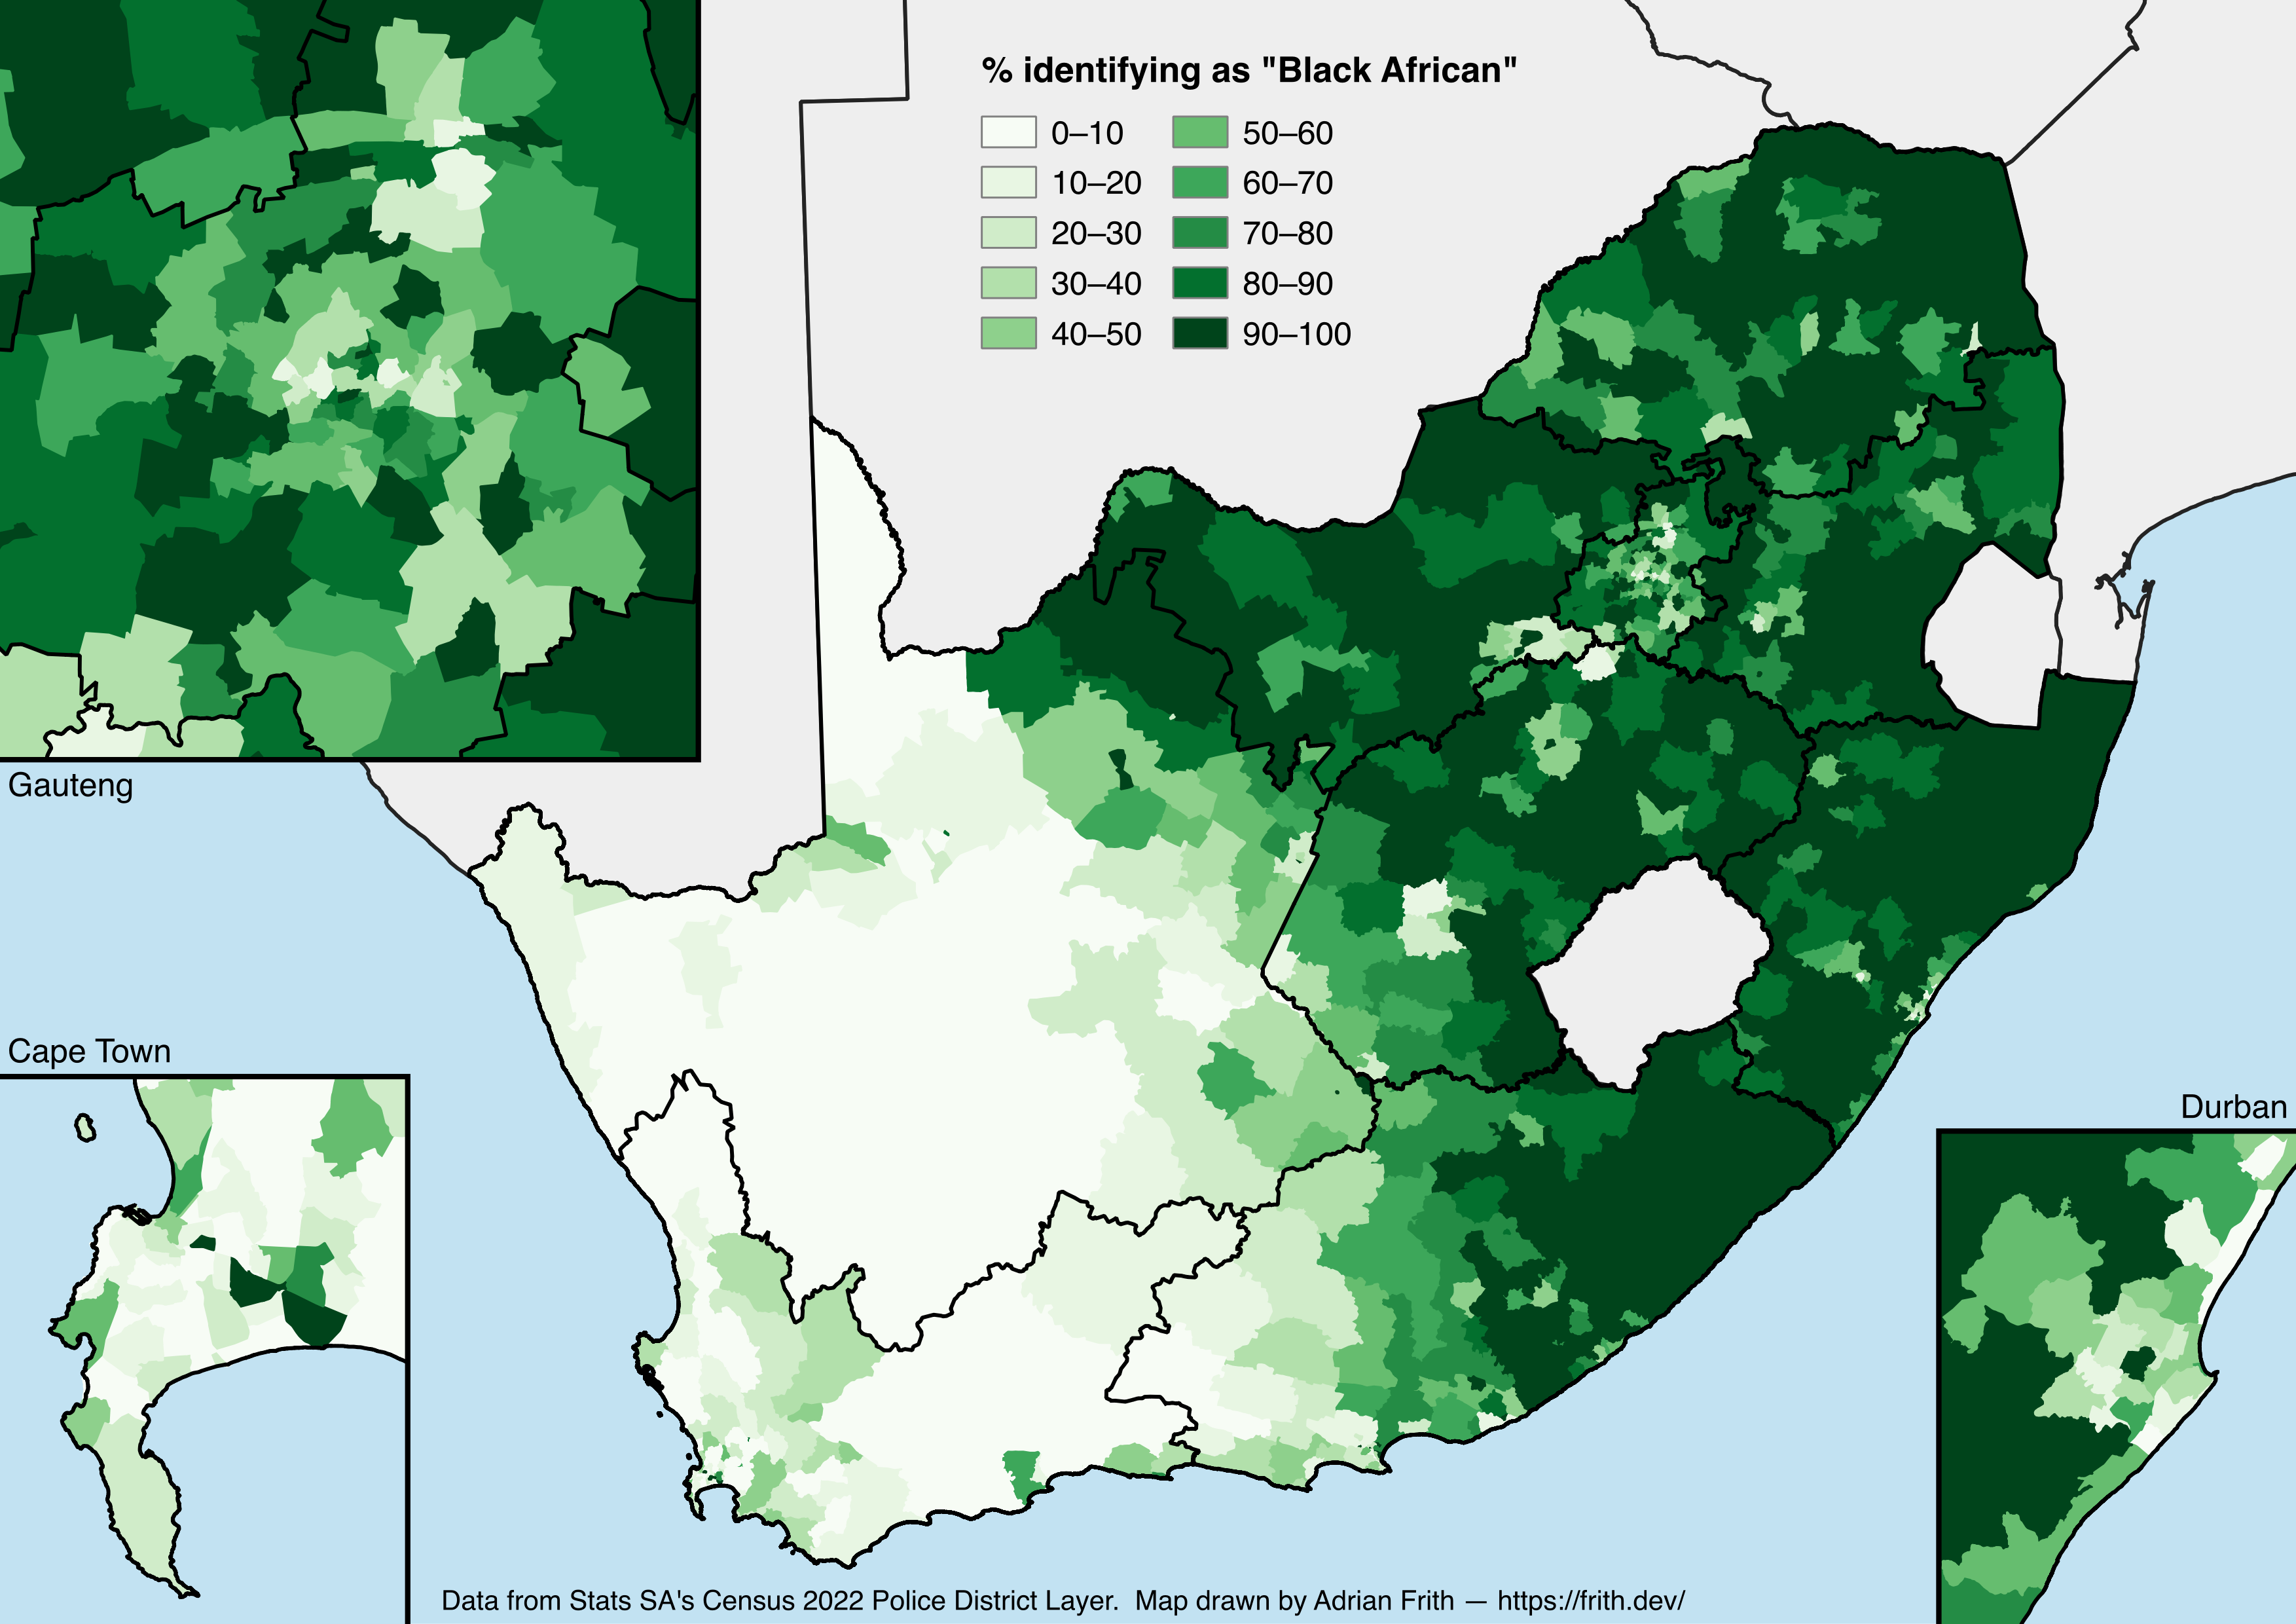
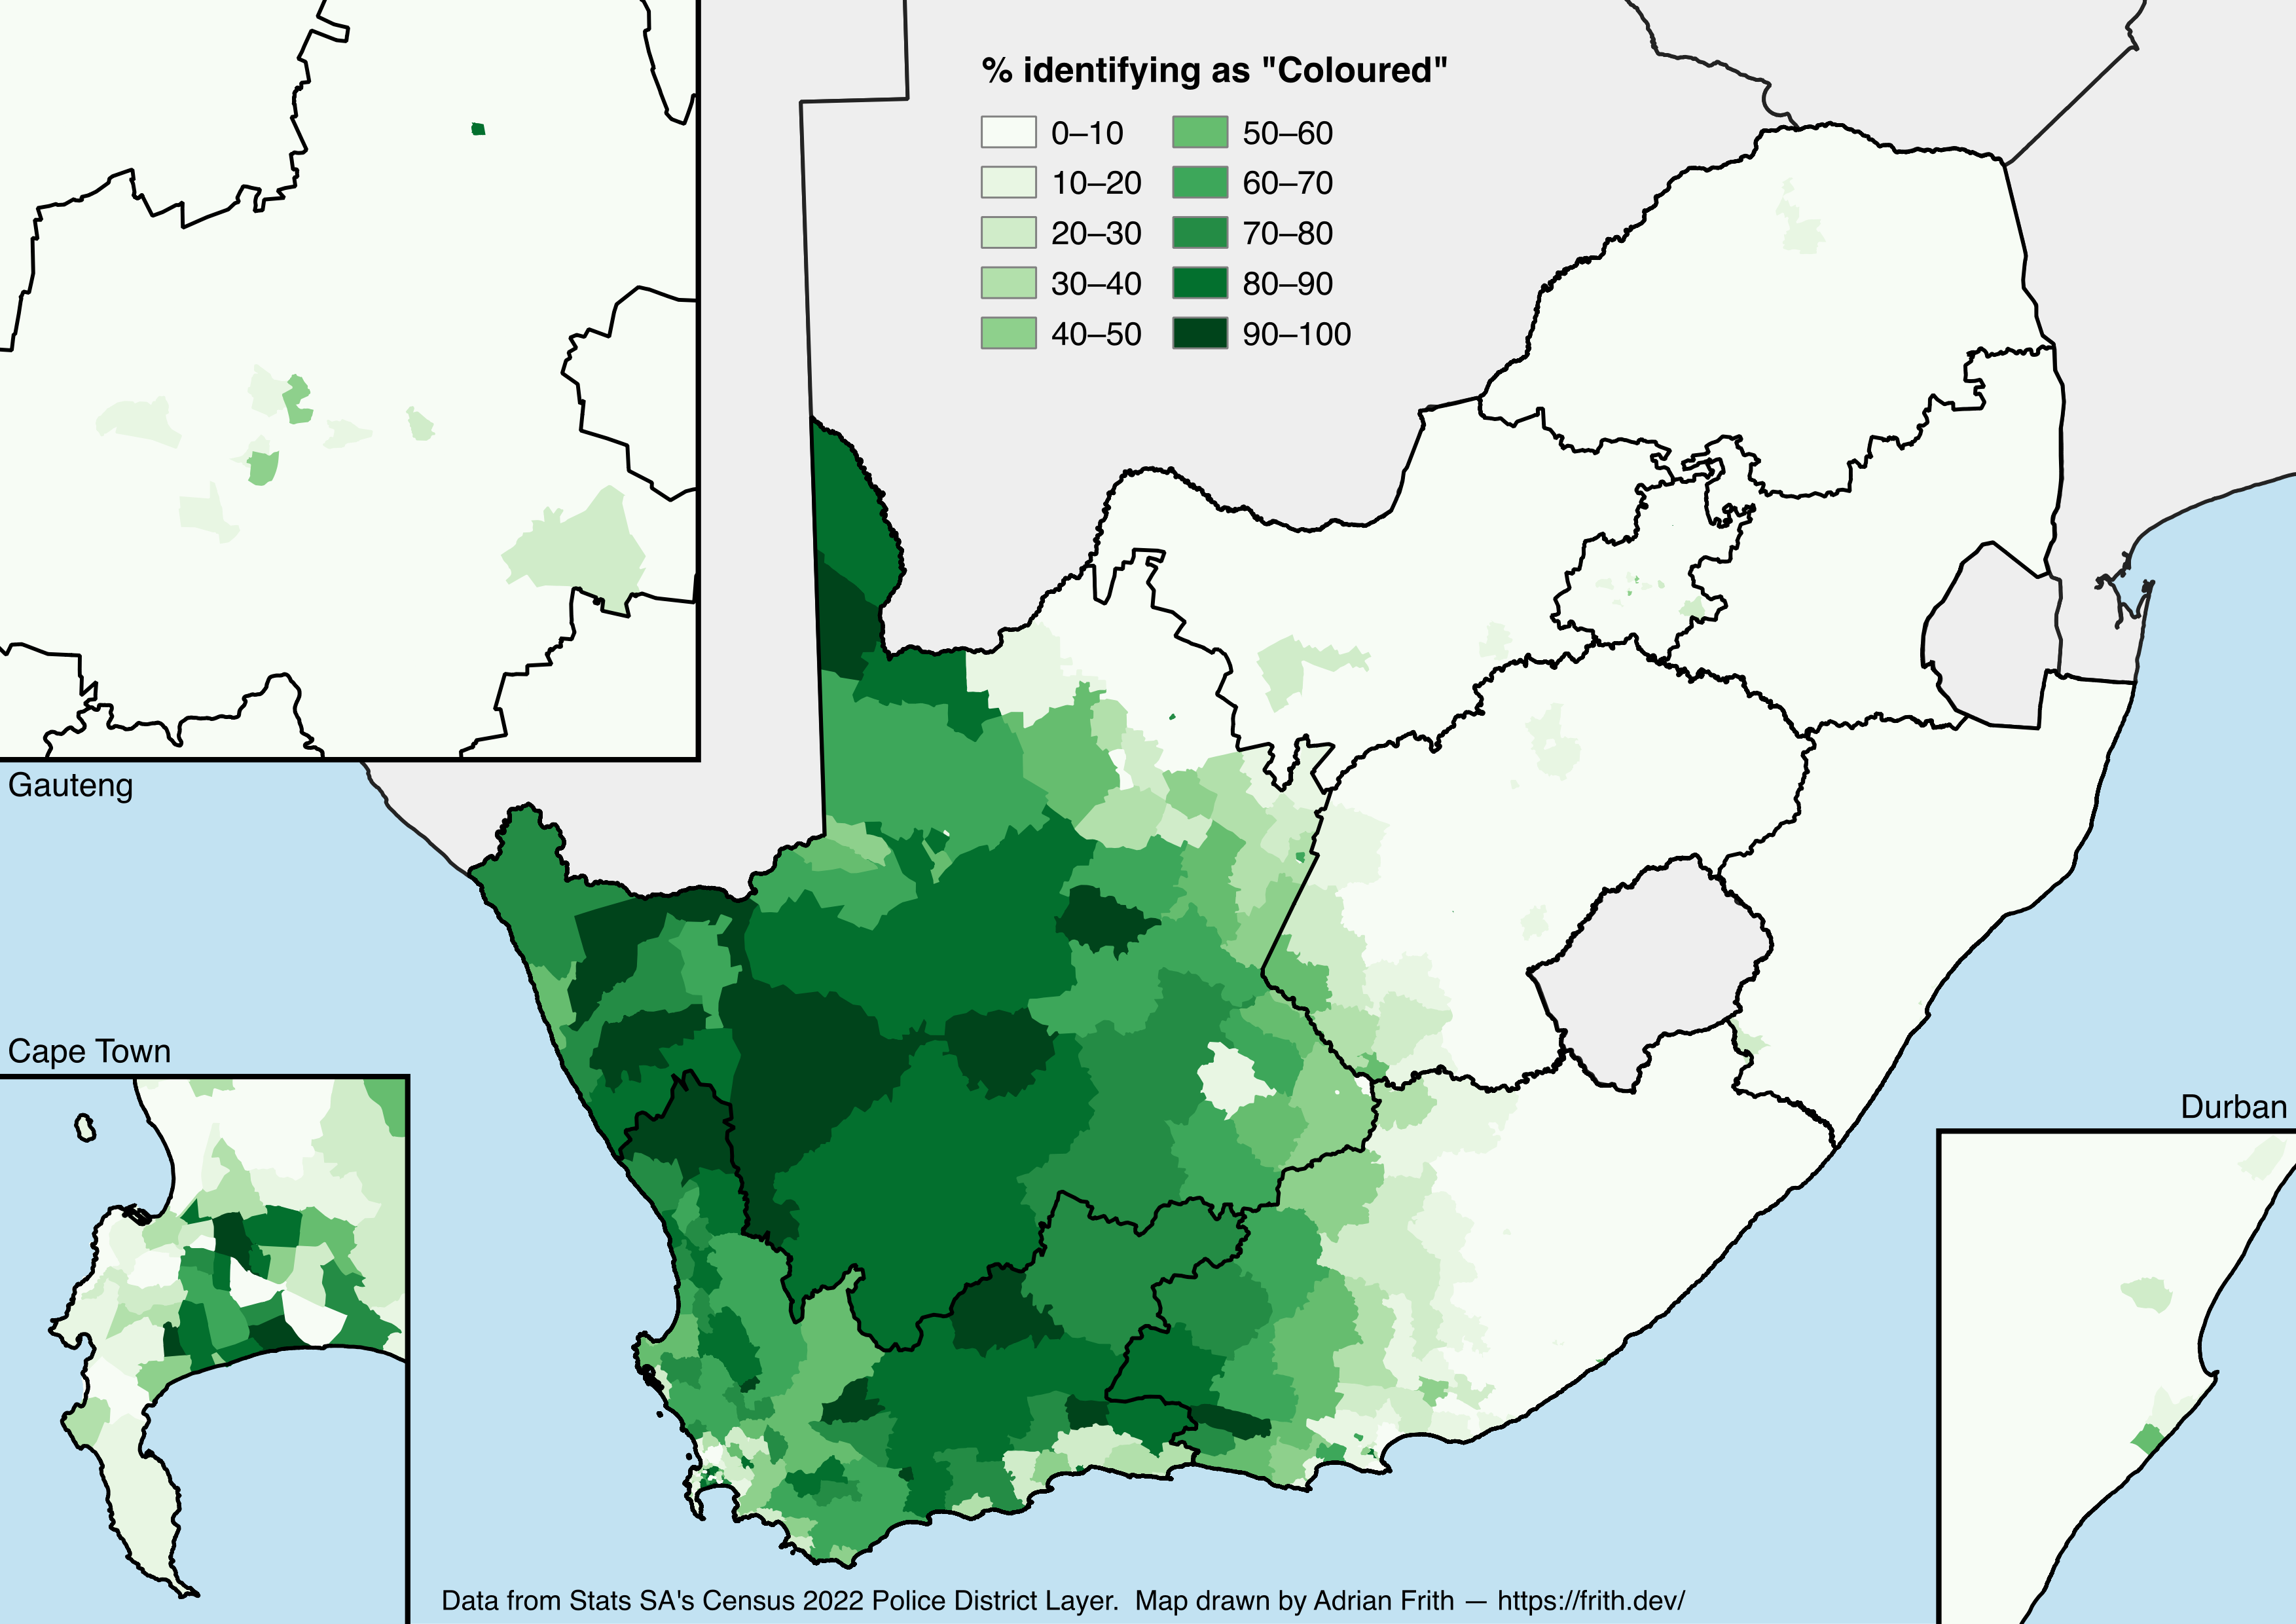
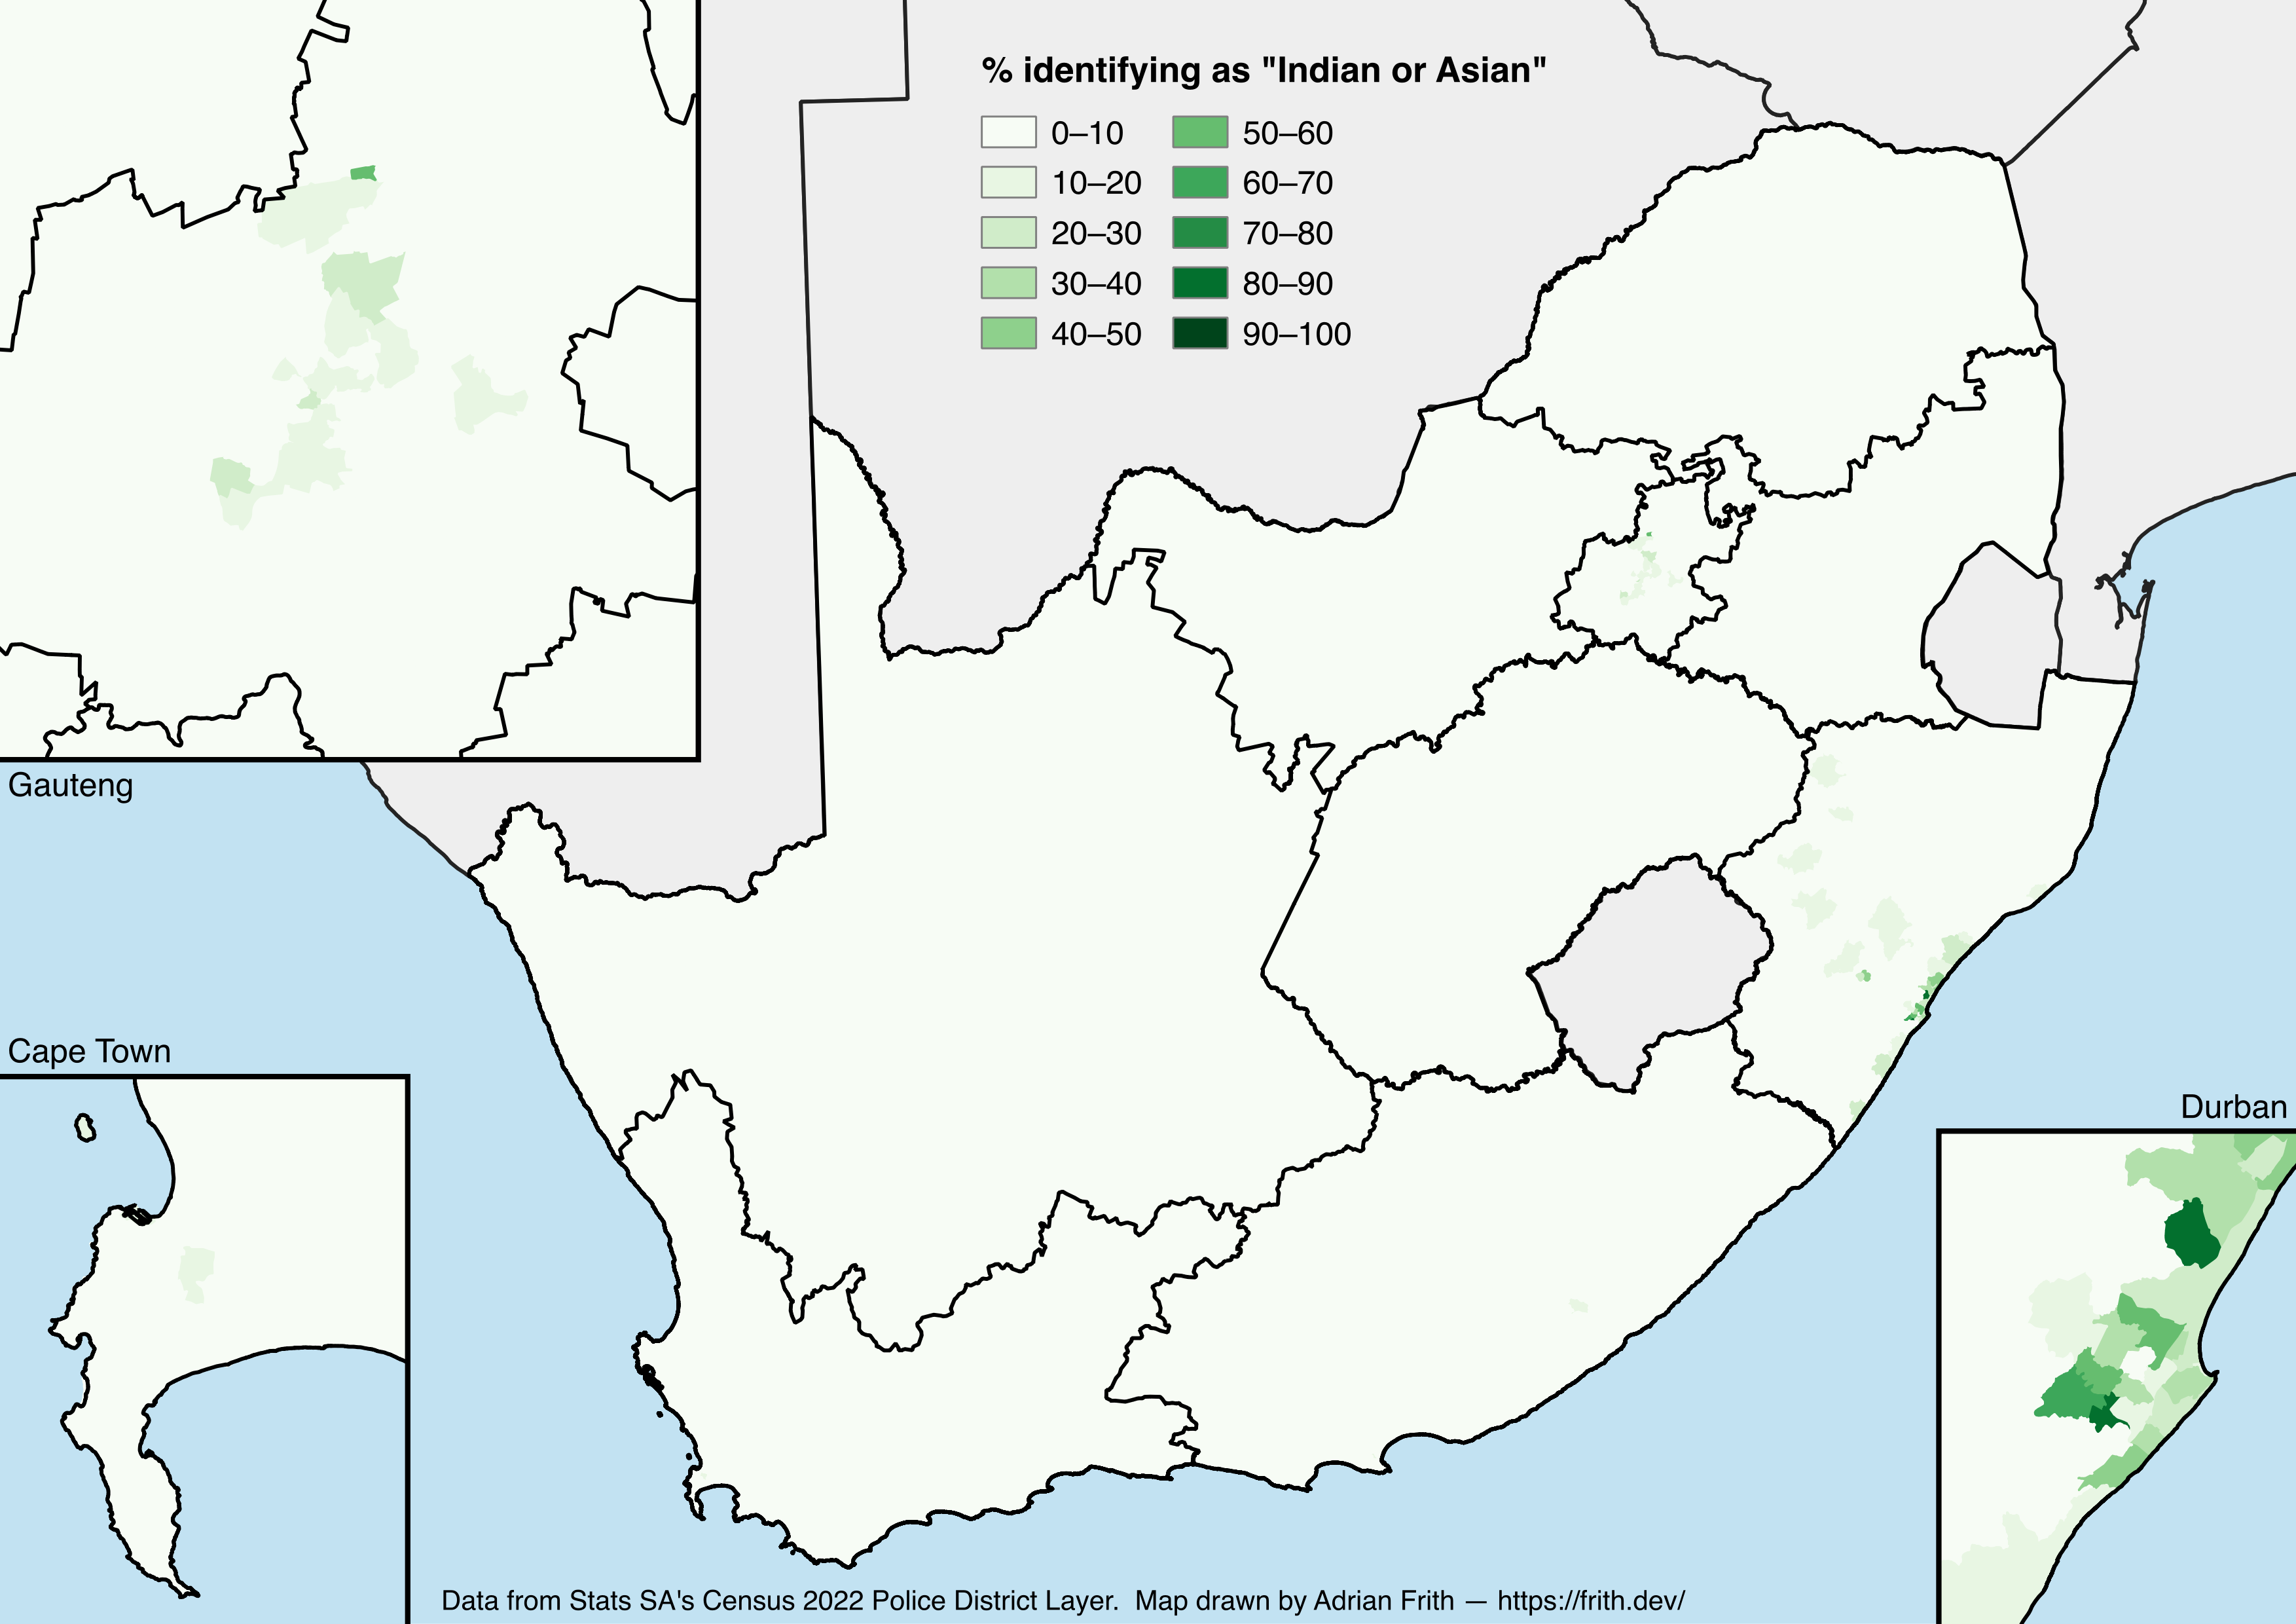
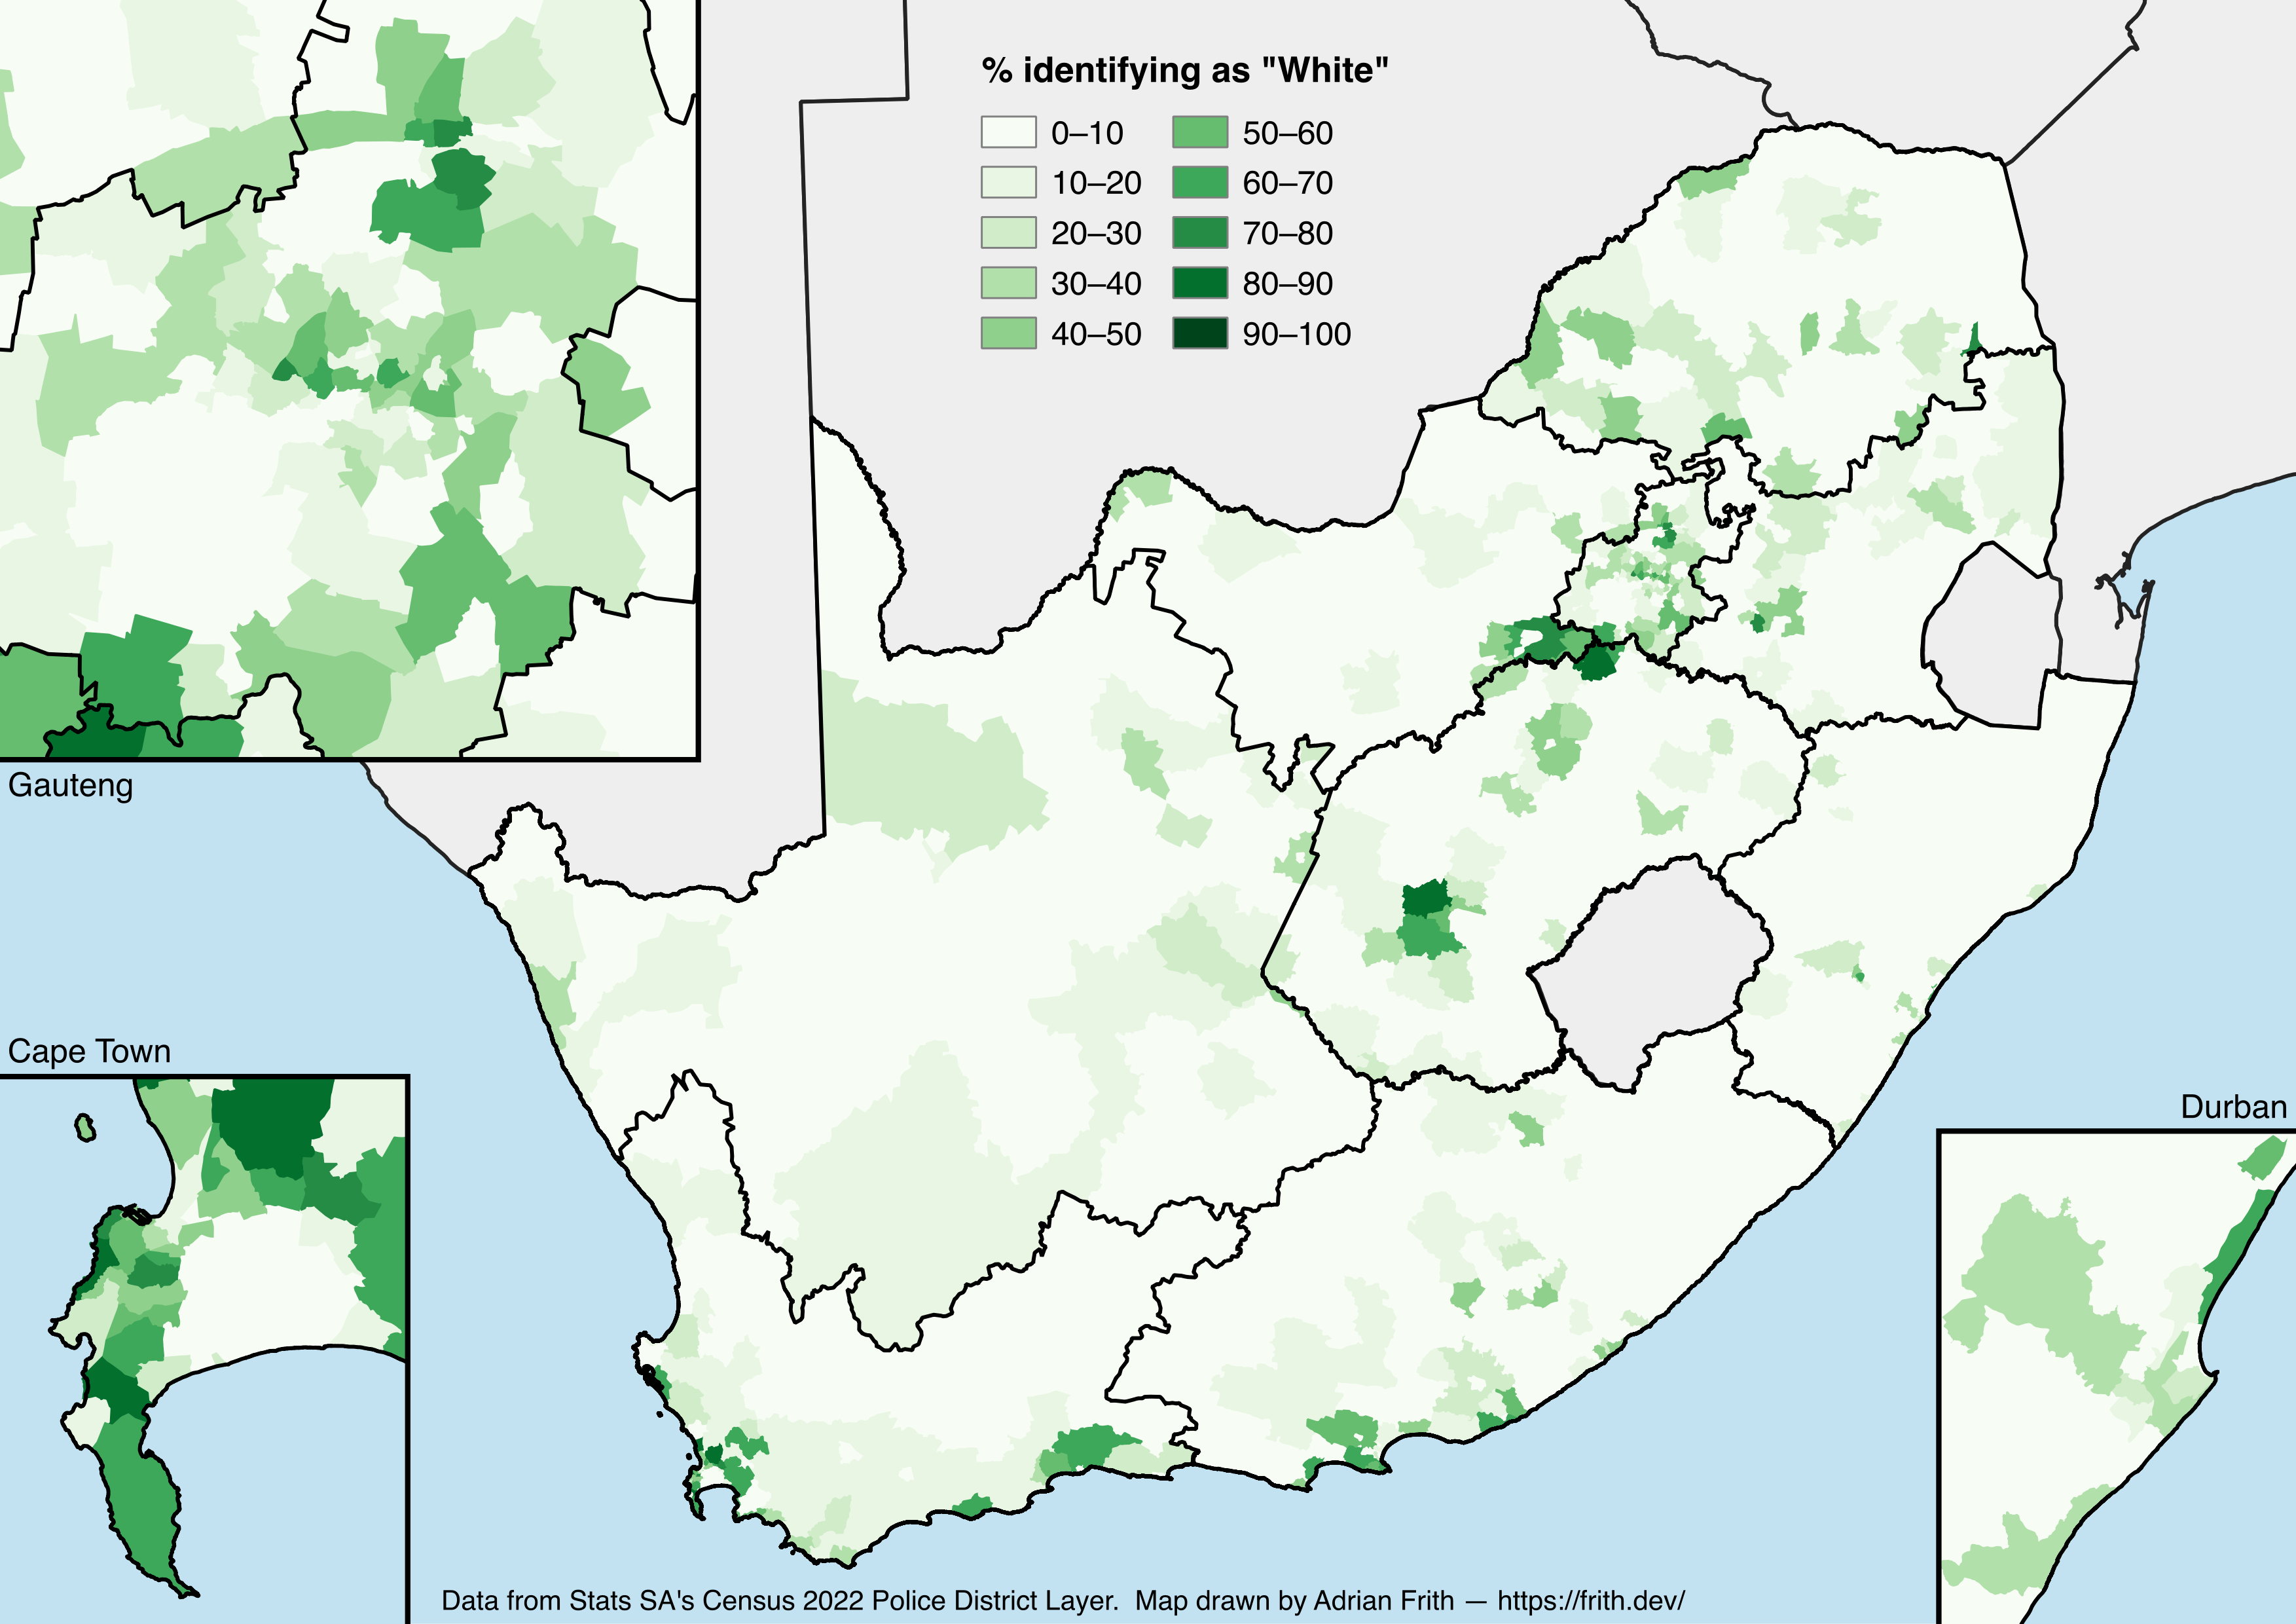
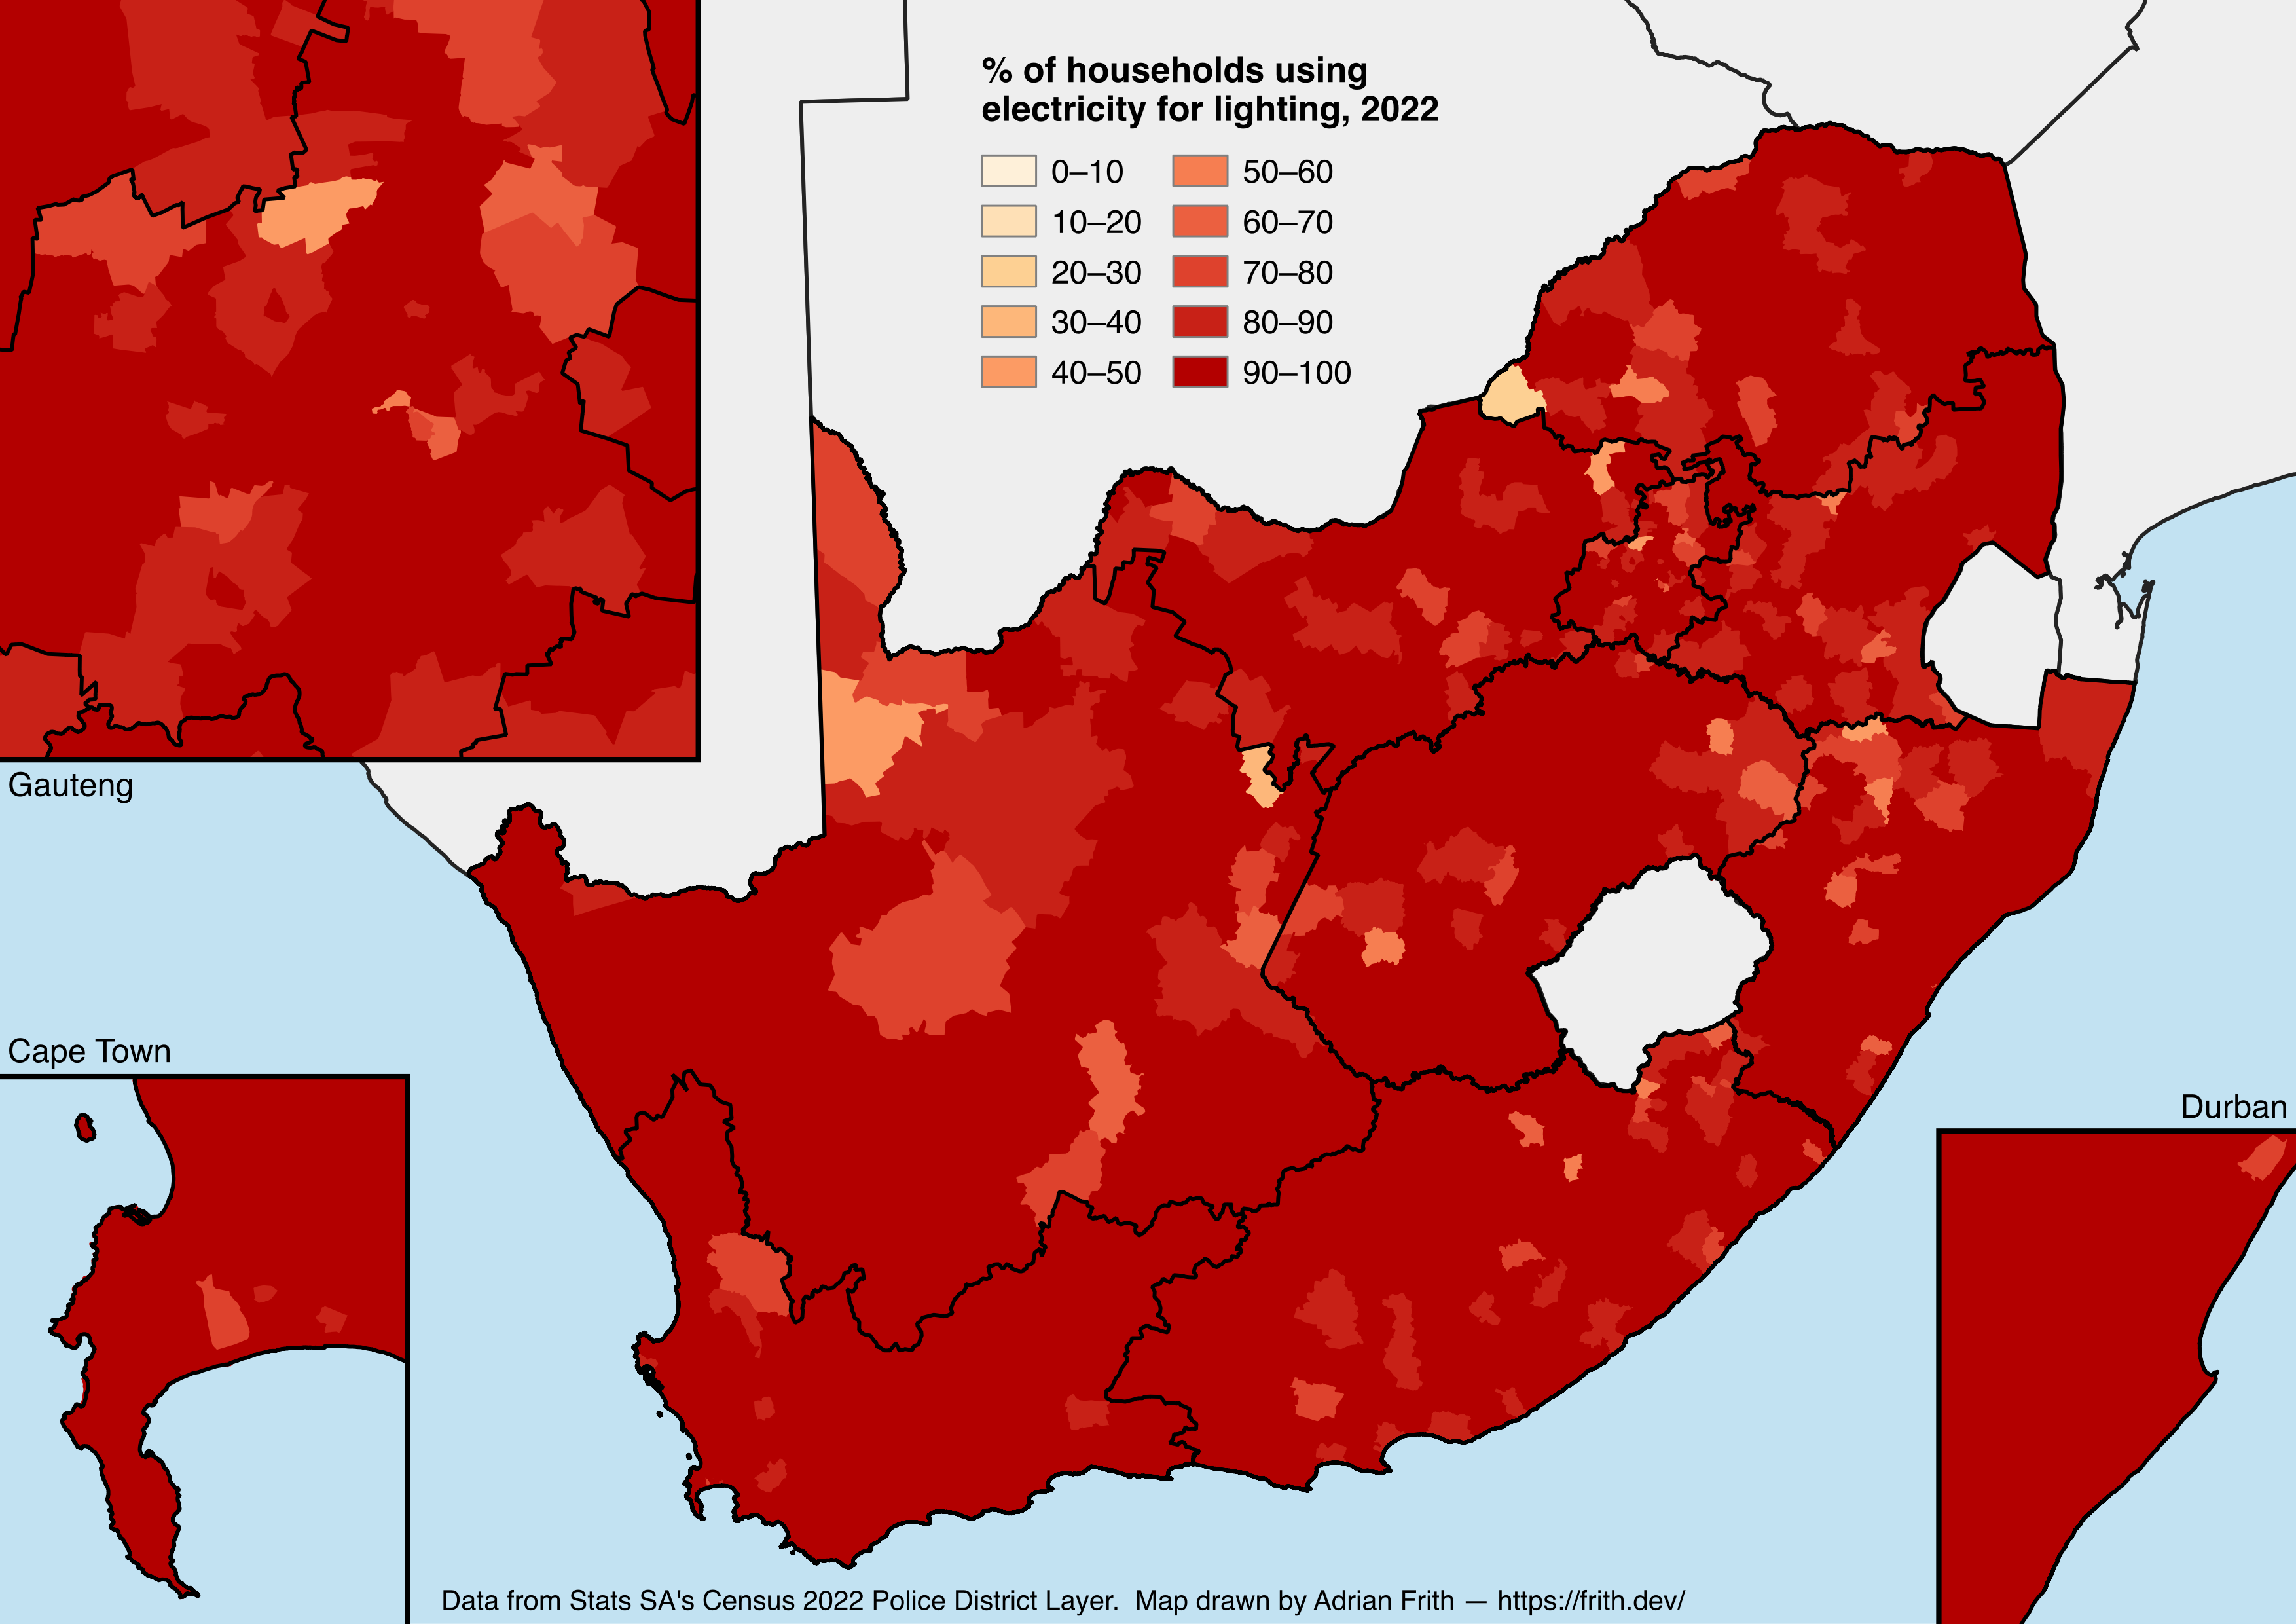
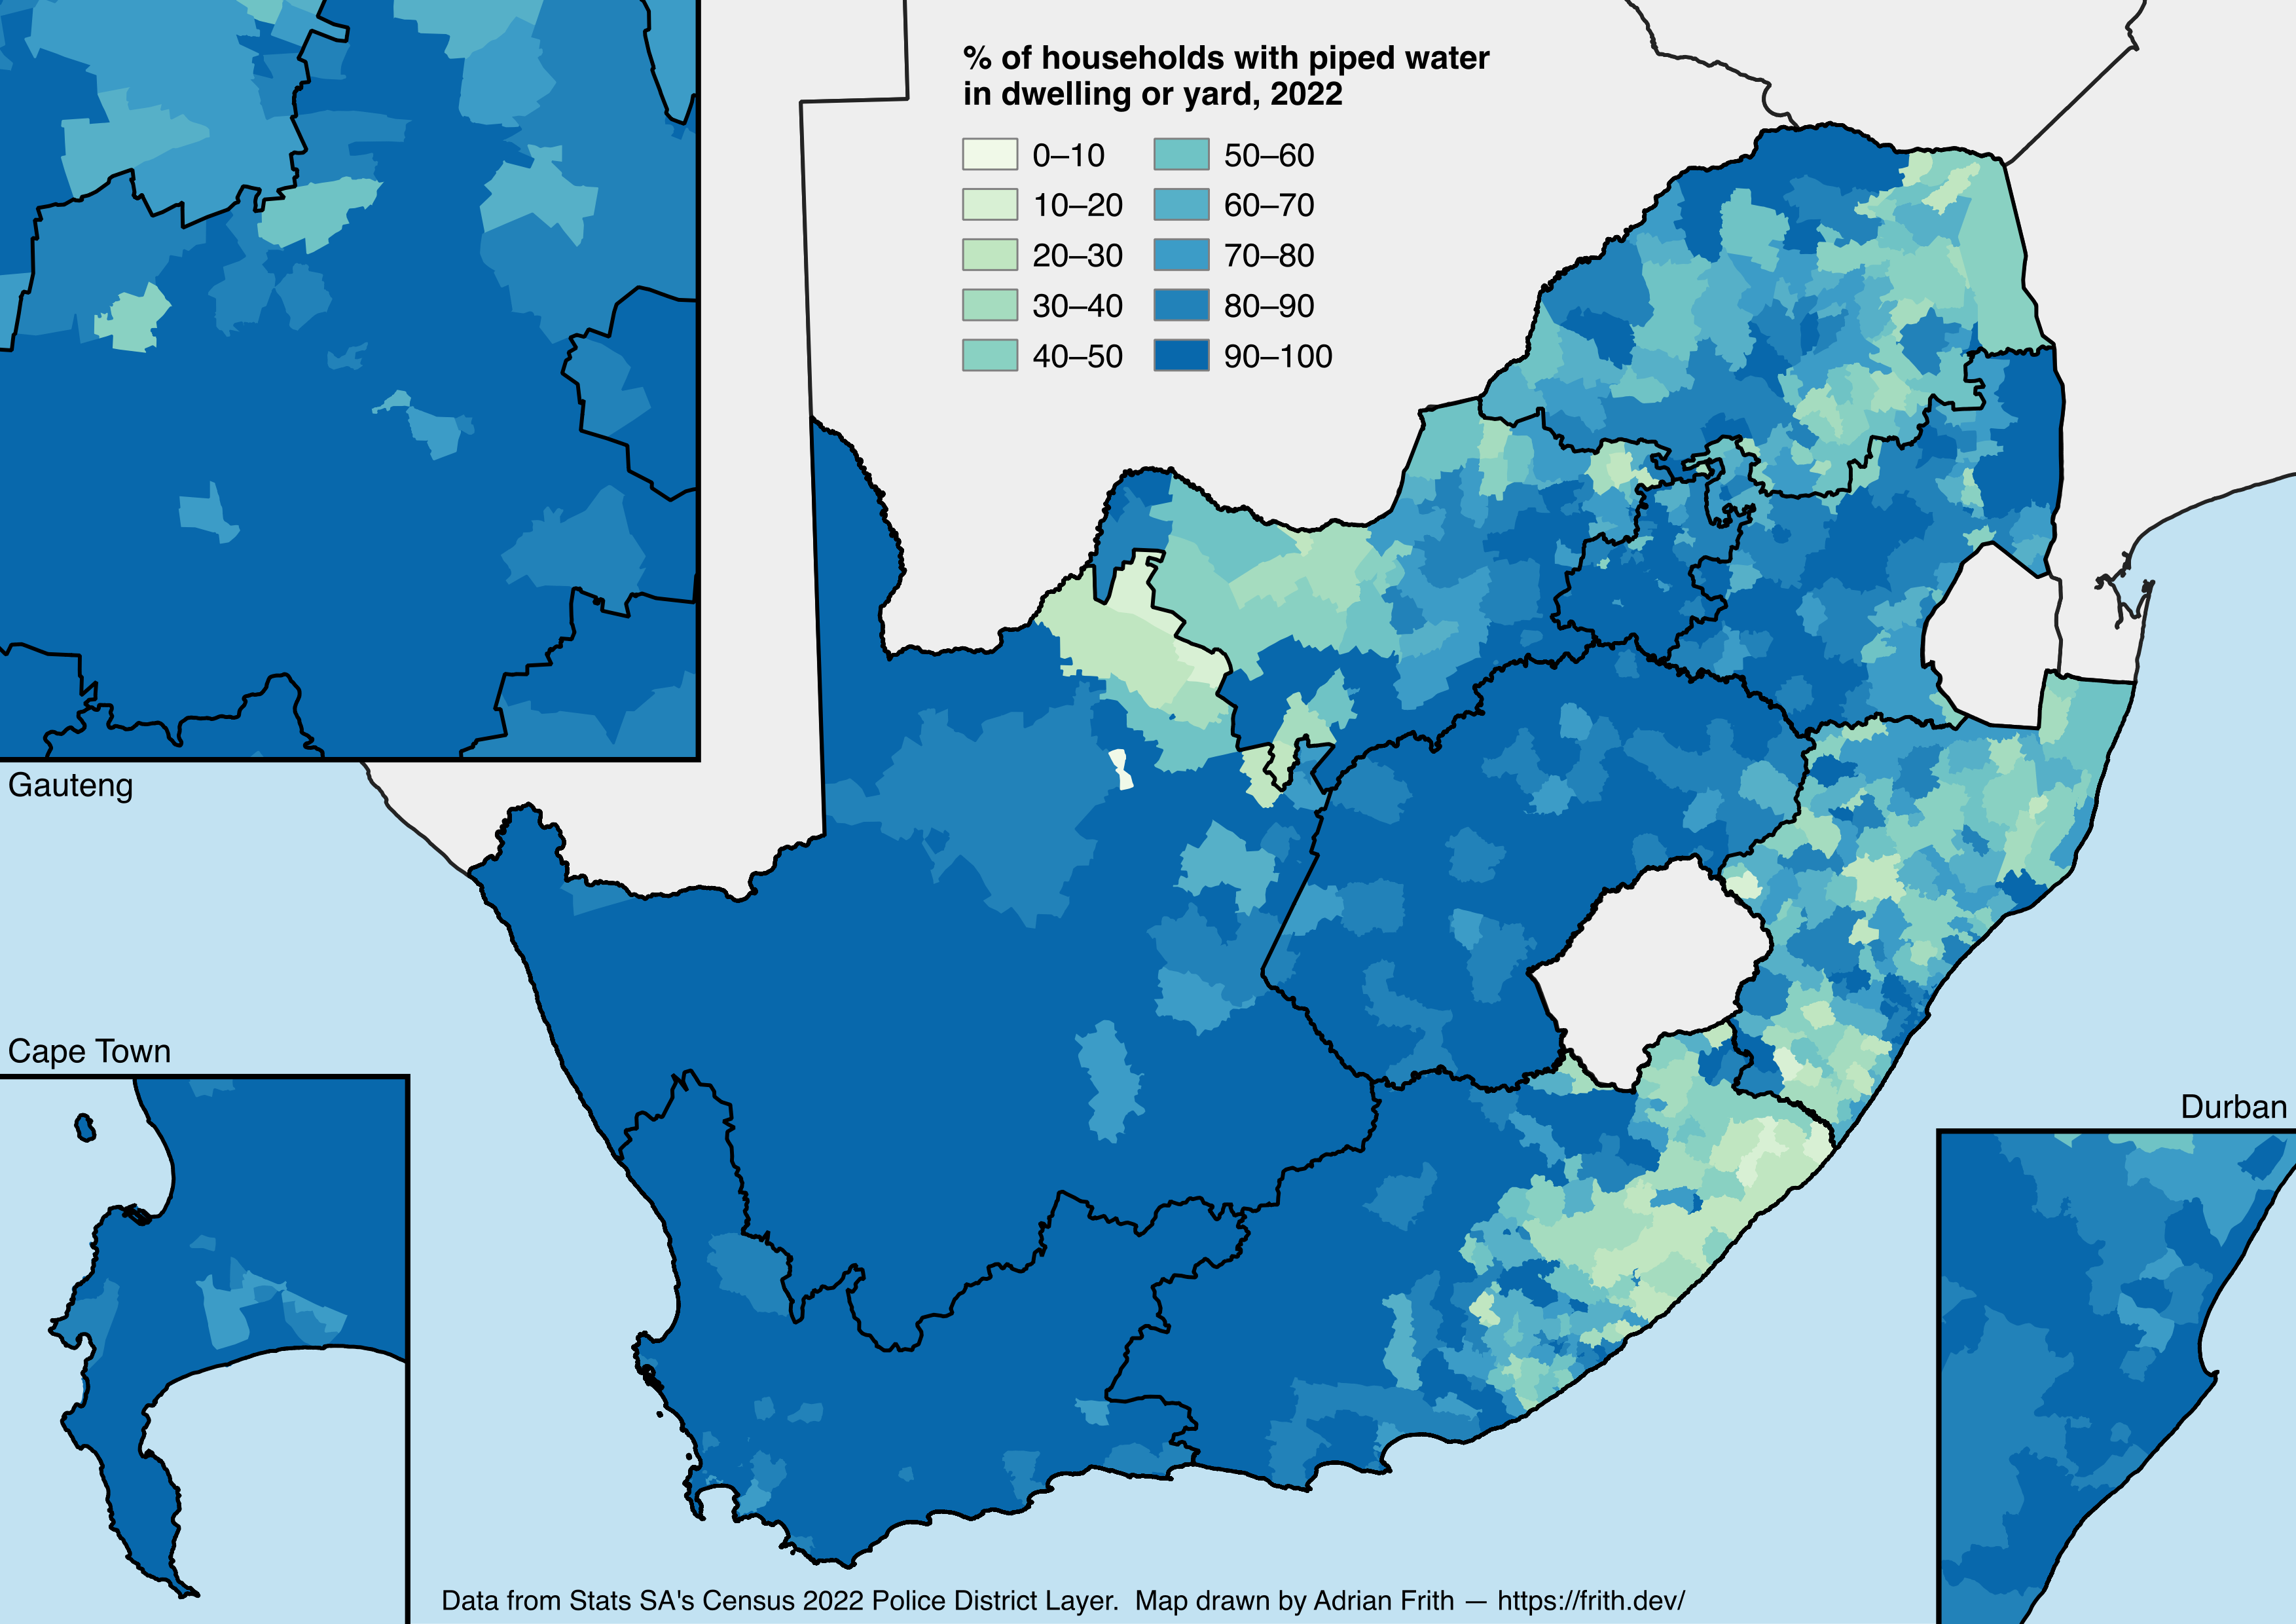
These maps were produced with QGIS. Feel free to reuse or republish them under the terms of the CC BY-SA 4.0 license.

Written on October 19, 2025